2. Data Analysis Methods and Procedures
2-4. EIQ Matrix
EIQ Analysis analyzes the correlation between E (Entry: Destination), I (Item), and Q (Quantity) based on shipment data. Its origin stems from the "Seeding Sheet" used in traditional warehouse piece-picking operations.
In Tera Calculation, this is expanded into "SEIQ" by incorporating product dimensional data, enabling automated conversion and visualization into practical logistics metrics such as cases, pallets, volume, and weight.
1) Shipment Scatter Plot
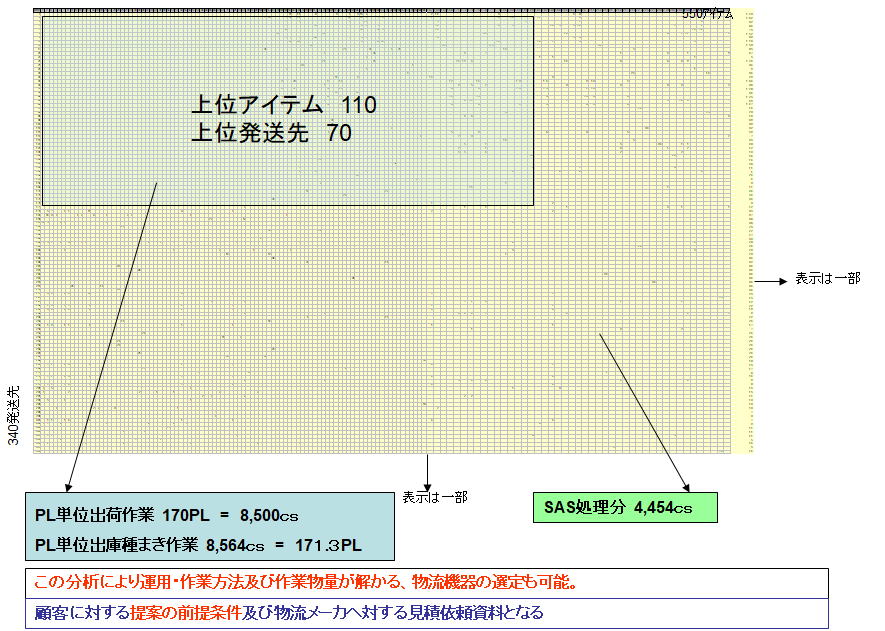
The Shipment Scatter Plot represents each cell in the EIQ table with a plot point whenever shipment activity exists, displaying overall shipment data on a single screen.
- Features: Highly effective for gaining an intuitive bird's-eye view of massive datasets involving thousands of items and hundreds of destinations.
- Limitations: While useful for identifying overall distribution density and patterns, specific quantities (Q) or detailed volume metrics cannot be directly read from the scatter plot.
2) Cross-Tabulation of Shipment Data (EIQ Table)
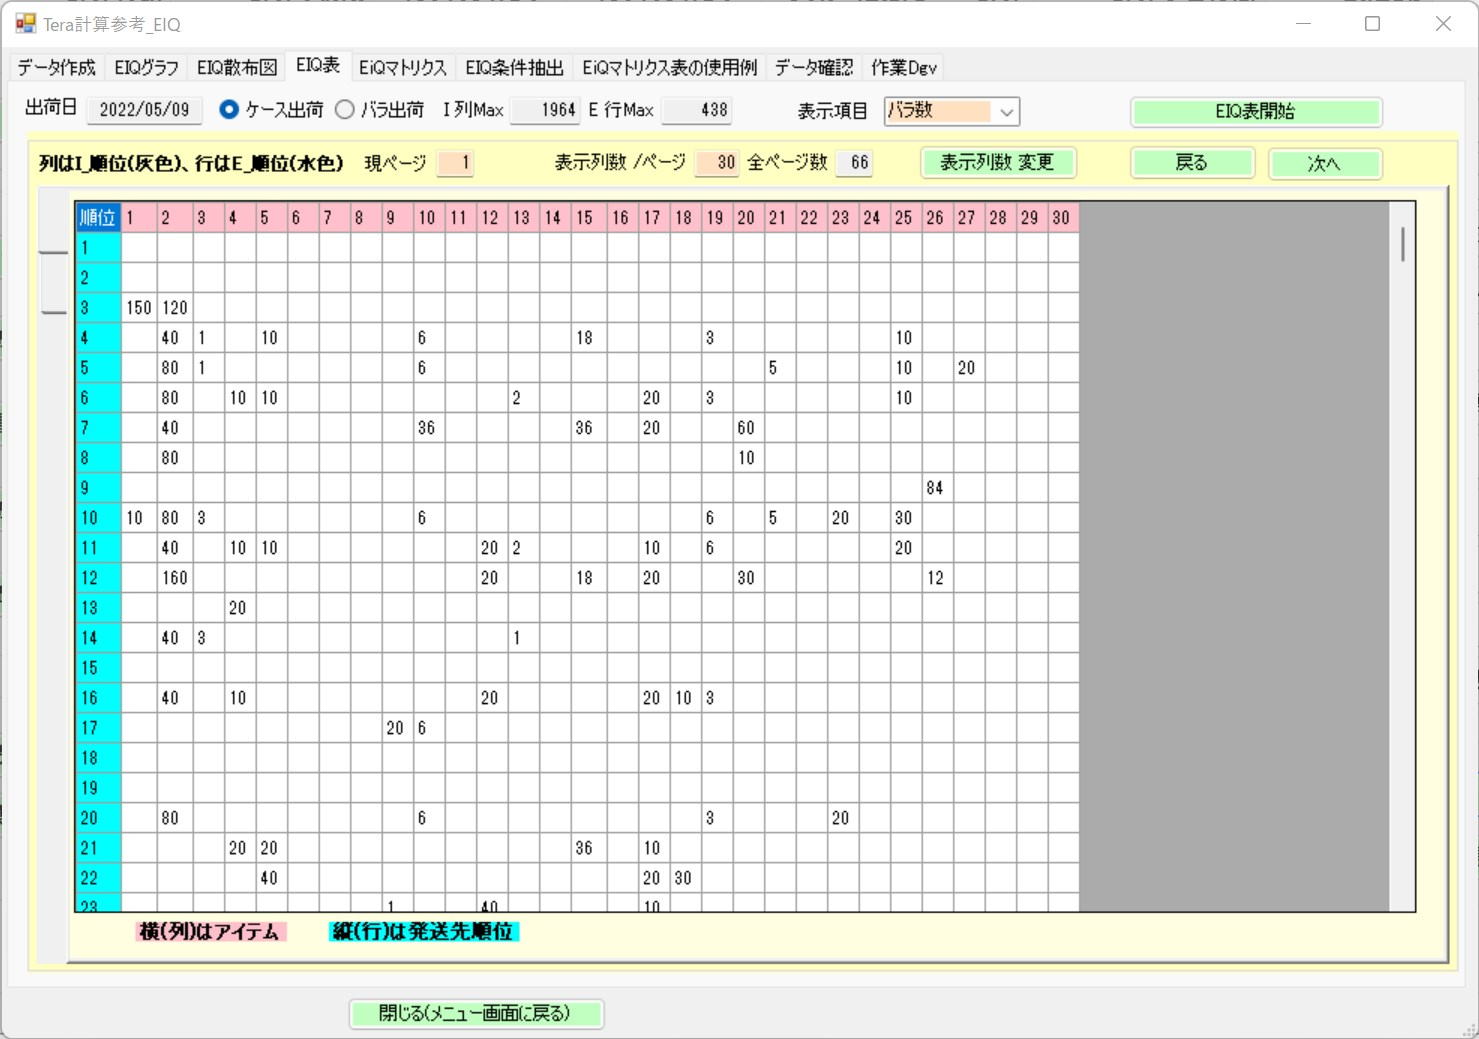
The EIQ Table (Seeding Table) is a massive matrix placing Items on the vertical axis and Destinations on the horizontal axis, sorted by item shipment quantity in descending order.
- Data Scale: A matrix such as "430 destinations × 1,984 items" contains too much data for human inspection at a glance. To manage rendering and PC processing loads, data is displayed across multiple paginated views (e.g., 66 pages).
- Analysis & Insights: Blank entries for Top 1 and 2 destinations indicate operational strategies, such as scheduled non-shipping days for major destinations while handling urgent orders for minor items.
3) EIQ Matrix Table
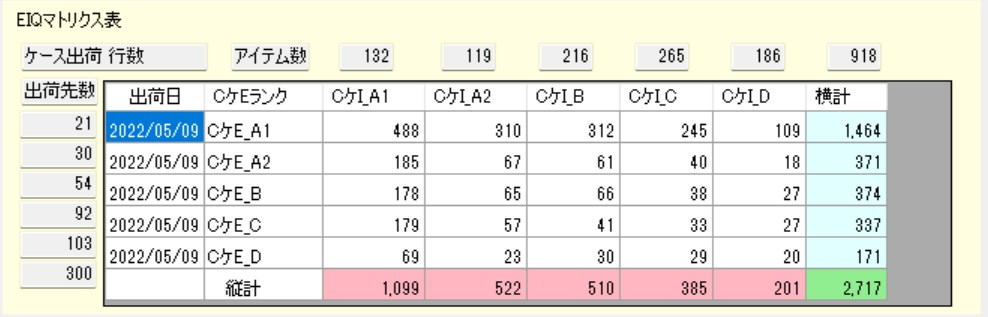
The EIQ Matrix Table aggregates the large EIQ table into 25 blocks (5 Item blocks × 5 Destination blocks).
- Practical Application: Provides an optimal grouping structure when assigning equipment, automated systems, or storage zones during warehouse facility design.
- Flexible Unit Conversion: Allows mutual conversion and analysis across picking order lines, piece counts, case quantities, pallet counts, and volume (m³).
- Rankey Ratio Settings: Assigns volume percentages (Rankey Ratio) to each block relative to total volume (100%), which can be dynamically customized within Tera Settings for simulation.