2. Analysis Methods & Procedures
2-3. Data Analysis Methods (EIQ Analysis)
1) What is EIQ Analysis?
The EIQ method was developed and named by logistics consultant Mr. Shin Suzuki, consisting of EIQ system thinking and EIQ analysis.
EIQ represents the core factors of logistics:
Number of Orders: E (Order Entry)
Number of Items: I (Item)
Quantity: Q (Quantity)
When details like Shape, Size, and Weight (S) are added, it expands to SEIQ.
2) EIQ Graphs
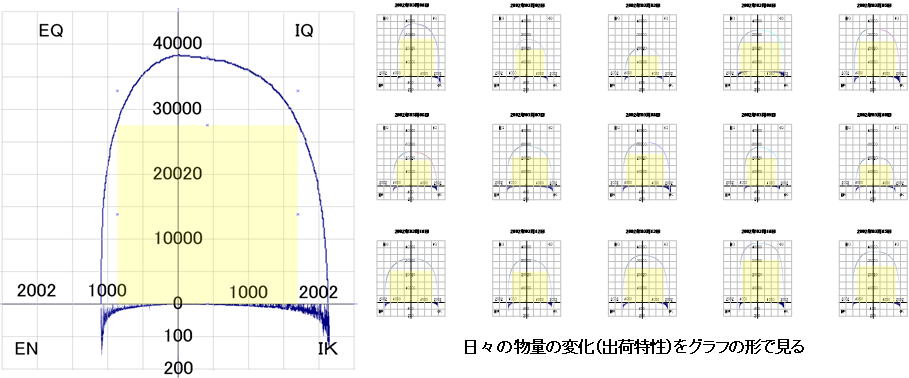
[Explanation] 4 Basic EIQ Graphs & Visualizing "Daily Fluctuations"The left side of the diagram combines four core EIQ perspectives (EQ, IQ, EN, IK) into a unified cross graph:
- EQ (Quantity per Order / Customer): Shows shipment volume per customer destination (identifying major accounts).
- IQ (Quantity per Item): Shows shipment volume per product item (identifying Rank-A items).
- EN (Lines per Order / Customer): Shows how many item varieties (order lines) are requested per customer.
- IK (Picking Frequency per Item): Shows how many times (destinations) a specific item is picked.
The right side shows these composite graphs arranged daily like a calendar. This allows teams to intuitively grasp daily volume fluctuations (shipping trait waves) by observing the visual "shapes" of the graphs—such as identifying Monday peaks in large-volume EQ or weekend variance in IQ.