2. Analysis Methods & Procedures
2-2. Customer Understanding of Shipping Traits
1) Understanding Cargo Volume
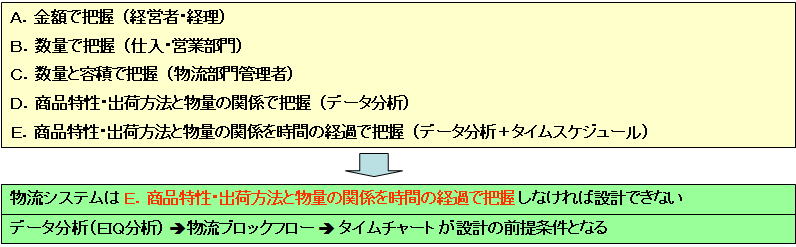
Different departments within a company understand "cargo volume" at different levels depending on their perspective and goals:
- Level A: Understood by Monetary Value (Executives / Accounting)
- Level B: Understood by Quantity / Units (Purchasing / Sales)
- Level C: Understood by Quantity & Volume/Cube (Logistics Managers)
Most companies stop at "Level C." However, designing an actual logistics center system requires deeper analytical insight:
- Level D: Understood by Relationship between Product Traits/Shipping Methods & Volume (Data Analysis)
- Level E: Understood by Relationship between Product Traits/Shipping Methods & Volume over Time (Data Analysis + Time Schedule)
Therefore, establishing "Level E (Product Traits / Shipping Methods / Volume / Time Relationship)" is a mandatory prerequisite for logistics system design. The 3-step process to achieve this consists of: "Data Analysis (EIQ Analysis) ⇒ Logistics Block Flow ⇒ Time Chart."
2) What is a Logistics Block Flow?
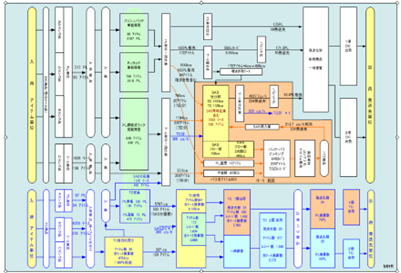
[Explanation] Role of the Logistics Block FlowBased on data analysis (e.g., EIQ analysis) results, the block flow is a visual blueprint mapping cargo movement (flow lines) and processing volume from receiving to storage, picking, sorting, and shipping.
The diagram illustrates how flows split or merge according to packaging units (pallets, cases, pieces) or temperature zones (ambient, cold storage, etc.). By showing how much volume (pallets, cases, order lines) flows into each work area, it serves as the foundation for calculating required equipment capacity and workforce allocation.
3) What is a Time Chart?
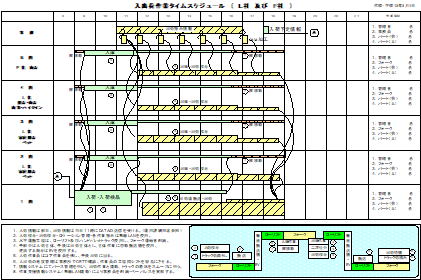
[Explanation] Role of the Time ChartThe time chart incorporates the concept of time into the material flows established in the logistics block flow.
In the diagram, time is plotted on the horizontal axis (e.g., 9:00 to 21:00) and work areas or operational steps (receiving, storage, picking, inspection, etc.) on the vertical axis, visualizing peak workloads for each process across the day. By simulating time constraints (Level E)—such as "what time picking must finish to meet a 15:00 truck departure"—it provides the final design basis for determining equipment utilization rates and staff shift scheduling.