1. Background of Data Analysis
3-2. Relationship with Logistics Process Flow
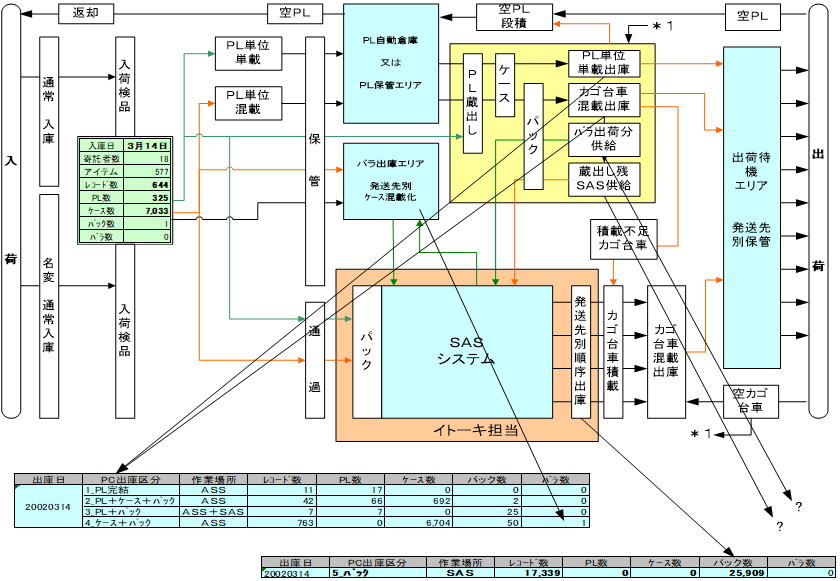
A Logistics Process Flow Diagram (Material Flow Diagram) structurally visualizes the physical movement of goods inside a distribution center (from receiving, inspection, putaway, bulk storage, replenishment, picking, sorting, packing, staging, to outbound loading).
Rather than simply illustrating qualitative operational steps, it maps out "how much volume moves between processes, in what packaging forms, and through which handling methods." This assists engineers in identifying operational bottlenecks, minimizing travel paths between zones, and optimizing warehouse layouts.
2) Practical Steps to Create Quantitative Flow Diagrams from EIQ Analysis
To advance beyond generic conceptual diagrams and produce "Quantitative Logistics Flow Diagrams with Volume Figures" suitable for engineering design, Tera Calculation applies the following logic:
Step 1: Generating the "EIQ Matrix Table" via EIQ Analysis
Execute EIQ analysis on the target-day dataset (including future growth projections). Cross-aggregate volume into a 25-block matrix (5 Item Tiers × 5 Destination Tiers) to visualize full-case and loose-piece order distributions separately.
Step 2: Mapping Material Handling Equipment to the EIQ Matrix
Map specific storage and handling equipment to each block based on item velocity tiers:
- High-Velocity Tiers (A1, A2): Map automated pallet AS/RS, case AS/RS, mobile racking, flow racks, or automated sorters.
- Medium/Low-Velocity Tiers (B, C, D): Map pallet racks, stationary shelving, or carousel racks.
Step 3: Automated Calculation of Process Throughput Volumes
Based on equipment assignments, throughput volumes passing through each process line (Receiving Berths → Storage → Replenishment → Picking Zones → Sorting → Shipping Berths) are automatically calculated in physical engineering units (cases, pallets, pick lines, volume m³, weight kg).
Step 4: Finalizing Quantitative Material Flow Diagrams
Embed calculated process throughput numbers onto the directional arrows of the material flow diagram. Quantifying metrics—such as pallet transfers between storage and sorting or picking lines generated per zone—provides concrete design rationale for equipment sizing and footprint calculations.