1-2. Conventional calculation (ABC analysis) andTCalcdifference between
modernLogistics facility planning, it is impossible to optimally design increasingly sophisticated logistics centers by simply aggregating past data.TCalc uses conventional methods that have been used in the field for many years.ABC analysisThe rank-based aggregation method is called "conventional calculation."
In this section, we will discuss the conventional methods that cause the fragmentation of the meaning of data.ABC analysisTCalc's unique "EIQ matrixDifferences between “aggregation” and more accurateEquipment scale calculationWe will deeply explain the concept of data analysis to derive the following.
1. Differences in basic concepts between conventional calculation and TCalc
Limitations of conventional calculations (ABC analysis) and information fragmentation
conventionalABC analysiscalculates item totals (best sellers/dead sellers) and shipping destination totals (large items/small items) for A, B, and C from the shipping results, respectively.3 ranksThis is a method of dividing and aggregating the data independently.This method is suitable for looking at each "distribution of results", and the total values of the two tables will match.
However, the biggest drawback isThere is no relationship (correlation) between tables.is.As a result, it is not possible to grasp the three-dimensional structure of ``what proportion of top-selling products with item rank A are distributed to what rank of shipping destination (large wholesaler or small individual customer).'' If this information is missing, it will not be possible to accurately measure the appropriate area of the picking zone or the effectiveness of introducing automated equipment such as sorters, and the optimalLogistics facility planningThis was insufficient as basic data for operational considerations.
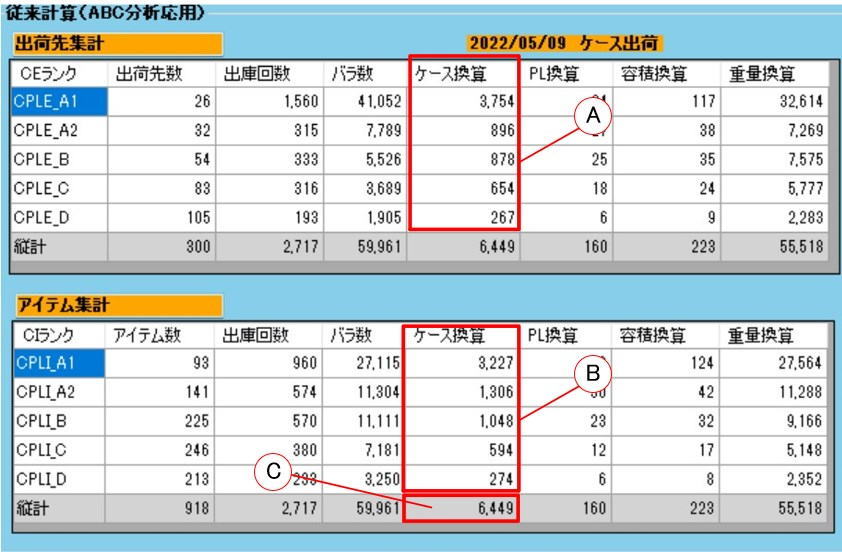
TCalc suggestion: “Correlate data”EIQ matrix table」
In TCalc, in order to solve this "information fragmentation", ranks are calculated more precisely.5 divisions (A1, A2, B, C, D)Item rank (5) × Shipping rank (5) =25 block gridWe use a method of cross-tabulating and correlating the data.this"EIQ matrix table"It is called.
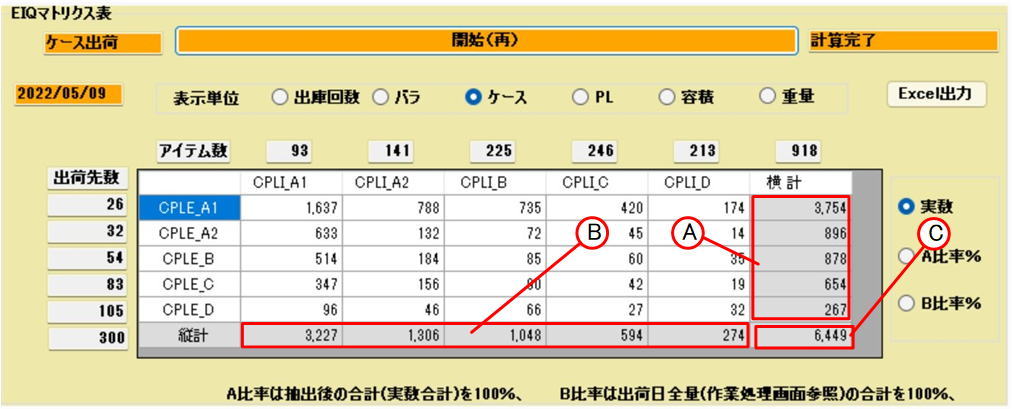
The biggest feature is that you can freely switch and display indicators that are essential in logistics sites, such as "number of lines (number of deliveries)," "number of pieces," "case conversion," "PL (pallet) conversion," "volume conversion," and "weight conversion" within the same rank division. This allows for three-dimensional visualization of the amount of materials required for each work area (for example, how many times picking will occur in which zone, how many cases will be required for replenishment, how many pallets will be transported, etc.), making it possible to perform highly accurate simulations.
2. Importance of EIQ matrix tabulation and diagramming
Section 1: Role of EIQ matrix summary table and improving readability
- Conversion rules for display units and ensuring consistency:
EIQ matrixThe displayed units of case, PL, volume, and weight are all converted values calculated from the standard "number of units".As a result, the horizontal total of the matrix table is always linked to the "item total" of conventional calculations, and the vertical total is always linked to the "shipping destination total", ensuring perfect consistency of the entire data.
- Intuitive understanding by grouping huge data:
The original raw EIQ table (for example, 400 shipping destinations x 4,000 items) will be so large that even spreadsheet software cannot scroll through it, and the human eye will not be able to read trends and its readability will drop significantly. In TCalc, this is grouped into 5×5 ranks (EIQ matrix(table), increasing practicality so that even management and field workers can grasp the situation at a glance.In addition, you can visually check the scattering of the distribution on the screen."EIQ Scatter Chart"It also supports intuitive analysis.
Section 2: Importance of “Tera settings” in facility scale calculation
When selecting logistics equipment (for example, determining the hourly processing capacity of sorters, etc.), it is common to refer to the amount of goods at peak times to prevent bottlenecks.However, determining the building area and the total number of storage racksWhen calculating the facility size of a distribution center, it is important to use the average of all shipping data (which is not biased on a particular day).Tera settings)” should be adopted.This is the golden rule of our institute.
- Reason for avoiding specific peak days 1 (coverage of all items):This is because if calculations are made based on only a specific shipping date, information about items that happened to not be shipped on that day (such as long-tail products) will be omitted, and the evaluation of the liquidity and storage efficiency of the warehouse as a whole will be greatly distorted. All data objects (Tera settings), it is possible to accurately cover the movements of all items.
- Reason 2 to avoid specific peak days (preventing excessive investment):As a general rule, it is the basic principle of logistics to temporarily absorb abnormal increases in volume during peak shipping periods by moving ahead from safety stock or increasing the number of personnel.Based on thisLogistics facility planningThis is to prevent the building area and fixed equipment of the center from becoming excessively large (over-specified) and resulting in unnecessary depreciation payments being made during the off-season.
Section 3: Reflection of aggregated time, route, and section information
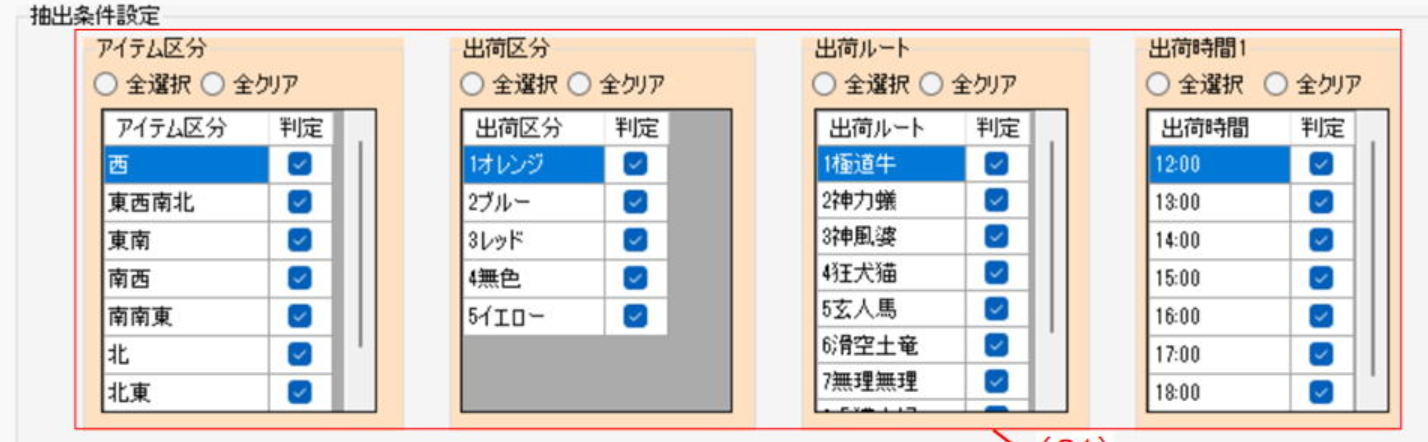
more relevant to the fieldLogistics facility planningIn order to practiceEIQ matrixThe following detailed attribute information is also reflected in the aggregation.
- Shipping time zone (1 hour division):Visualizes the degree of order concentration before closing time, and uses this to determine whether work can be moved forward or not, and to formulate efficient truck landing arrangement schedules (berth reservations) based on the volume of goods by time.
- Shipping route:It can be used to specify groups for company flights by direction (north area, south area, etc.), and to predict the amount of loading berth sorting work for each transport company, route service, or courier service to prevent platform congestion.
- Shipping classification/item information:It is used to specify the packaging style of Oricon/cardboard, etc. required for each shipping destination, and to understand the conditions and required space for special operations that occur at the time of receiving and shipping, such as distribution processing (tagging, price tagging) and quality inspection.
3. Example of operational application of EIQ matrix summary table
Section 6 Optimization of picking strategy using EIQ matrix
When you create a matrix of shipping destinations and products in descending order of quantity, the challenge is how to convert those numbers into actual operational rules.For example, as a result of data analysis, if a quantity group of "0.5 pallets or more/PIC (quantity generated in one picking)" can be extracted, this"Pallet shipping"It is defined as
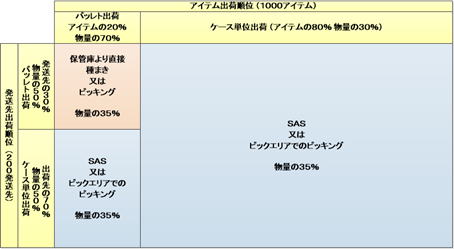
If this large group of pallet shipments were to be divided into smaller units using the SAS (Sequential Shipping System) or a regular picking area for small lots, the flow lines and effort would increase, resulting in a significant drop in efficiency. Therefore, it can be logically determined that it is best to use a forklift or the like to process 2 to 3 shipping destinations at once (sorting after picking the total amount) in a seeding area (sorting area) with a wide aisle. On the other hand, other small-lot groups can be identified as suitable for storage and retrieval in SAS or standard walk-picking areas.
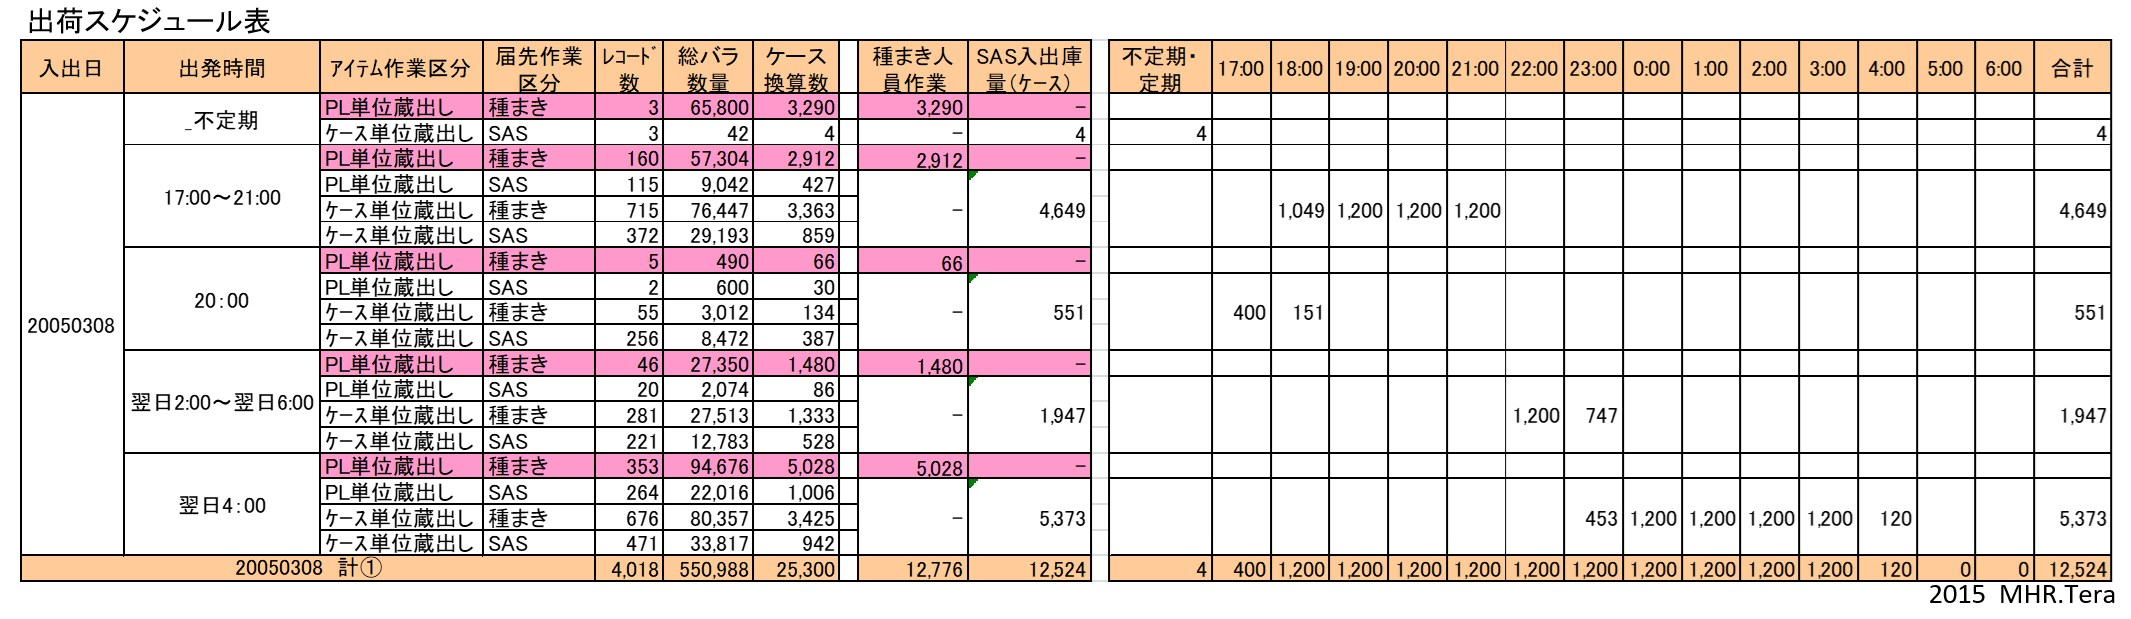
like thisEIQ matrixBy using tables, you can go beyond simply analyzing the current situation and accurately calculate when to replenish which items to which picking areas (SAS, etc.) and the number of containers required for each area, and incorporate them into a practical daily work schedule. The accumulation of this process results in no waste.Equipment scale calculationIt will bear fruit.