3-14.Example of project creation materials
1.Current issues and system construction ideas (examples)

[Illustrated explanation]It organizes the problems in current logistics operations (unbalanced workload, decreased storage efficiency, dependence on manual labor, etc.) and presents a basic concept for building a new system and an approach to solving them.
2-1.Logistics prerequisites (example)
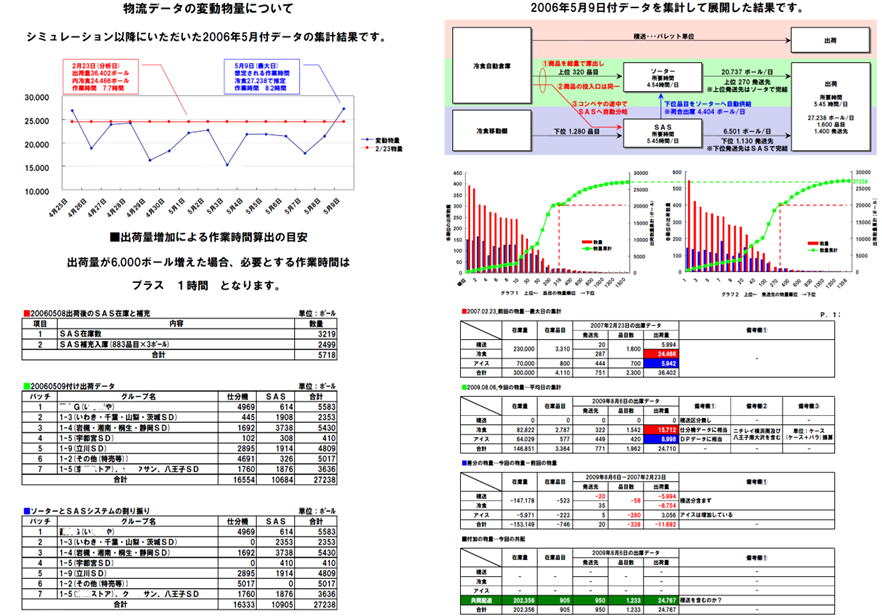
[Illustrated explanation]It shows fluctuation analysis based on past shipping data, future logistics volume forecasts, and equipment allocation standards.
- Fluctuation flow analysis of logistics data:Visualize trends in daily shipment flow.We ascertained the logistics volume and estimated work time during peak hours (maximum days) and defined a quantitative work time calculation standard: ``If the shipment volume increases by 6,000 balls, an additional 1 hour of work time is required.''
- Processing allocation and item analysis by equipment (sorter/SAS):
- High-ranking items (high shipping frequency) are automatically supplied to automatic cold food warehouses and sorters, achieving high-speed processing.
- Lower-level items (low shipment frequency) are sent to the refrigerated food mobile rack and SAS (sorting automation system) to achieve both storage efficiency and sorting accuracy.
- Comparison of sorting performance data by batch/area:Calculate and verify the number of balls distributed to sorting machines and SAS for each delivery group (district, SD, etc.).
2-2.Logistics prerequisites (example)
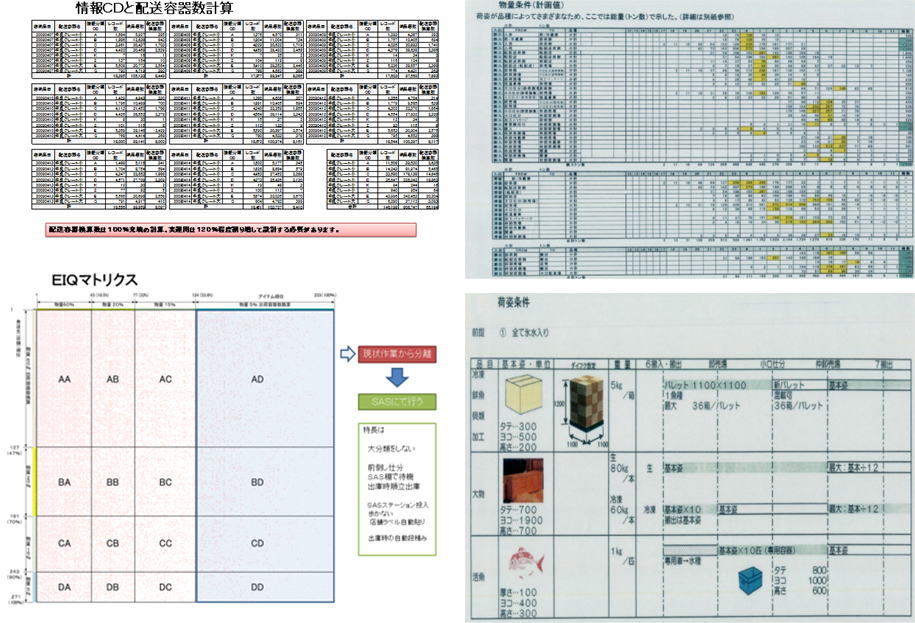
[Illustrated explanation]It shows calculation results of order data for logistics volume, packaging specifications (cardboard size, weight, pallet loading form), and EIQ analysis (Entry/Item/Quantity analysis) matrix.
- Information CD and shipping container count calculation:Based on actual results, we calculate the required number of shipping containers considering 100% filling and 120% margin.
- EIQ analysis:Classify categories according to shipping characteristics (low-volume, high-mix, high-volume, low-volume, etc.) and set optimal classification criteria for automated warehouse (SAS) and manual sorting area operations.
- Packing conditions:Define storage shapes (boxes, barrels, water tanks, etc.) and size/weight constraints for each item/temperature zone.
3.Logistics flow diagram (example)
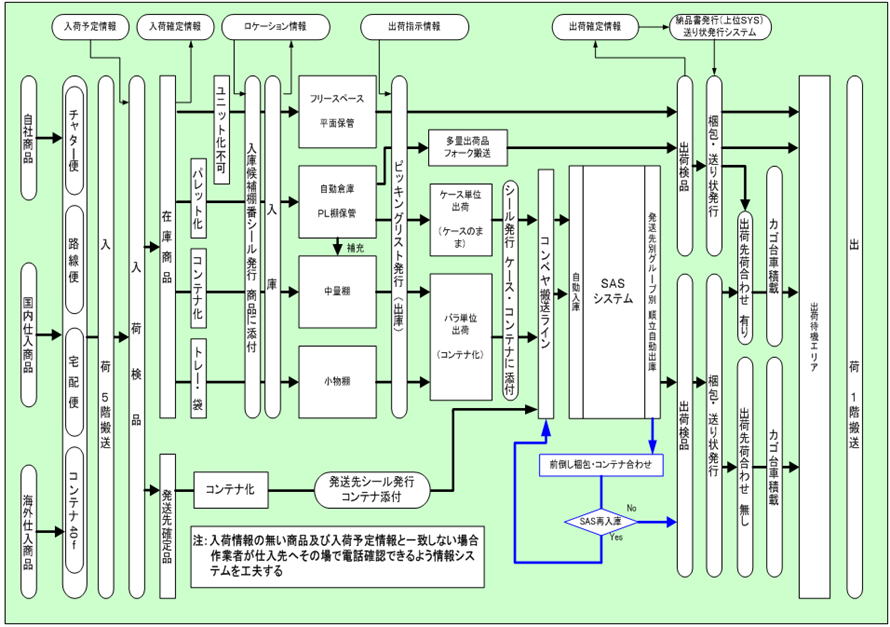
[Illustrated explanation]We have systematized the entire flow of business processes, from various delivery methods such as in-house products, charter flights, route flights, courier services, and containers to shipping packaging.
- Arrival/storage process:After cargo inspection and confirmation of acceptance, a "receipt candidate storage bin sticker" is issued after palletization/containerization/tray bagging.Optimal placement for automated warehouses, medium-sized shelves, small item shelves, free spaces, etc.
- Warehousing/picking process:By issuing a picking list, large quantities of products are transported by fork, case units are transferred directly to the conveyor line, and bulk items are distributed to SAS (automatic sorting system) linkage.
- SAS re-stocking/loading operations:Parcels on the conveyor are automatically sorted and shipped sequentially using SAS.Unfinished items will be re-stocked at SAS and will be combined ahead of schedule.
- Inspection/shipping process:After shipping inspection, packaging and invoice issuance (linked to the host system), and loading onto carts, the products are shipped from the loading area on the 1st floor to the delivery destination.
4.Space allocation/layout study (example)
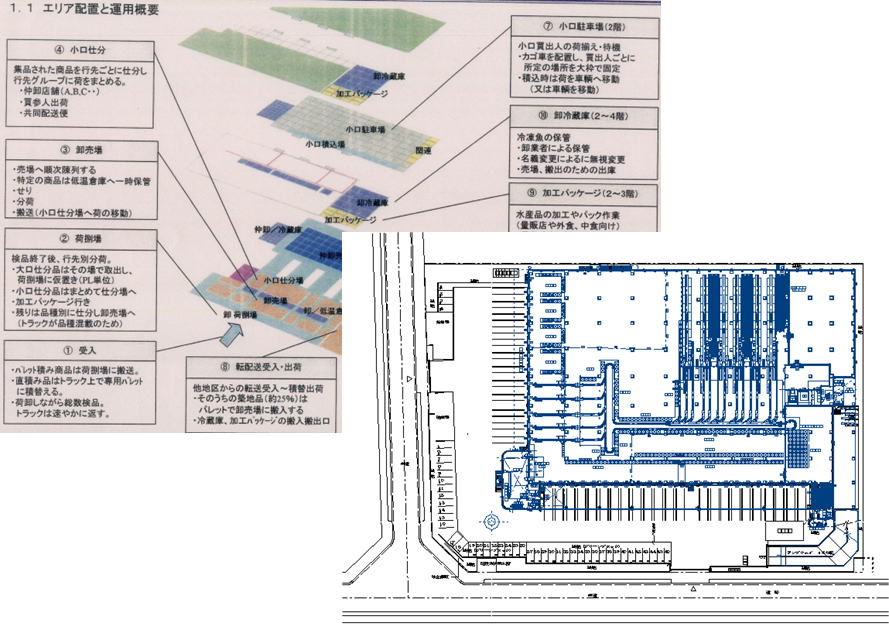
[Illustrated explanation]This is an example of the hierarchical area layout and CAD floor plan of a complex distribution center that includes marine products, refrigerated goods, small-lot sorting, etc.
- Area layout and operation overview:① Receiving (pallet/truck reception), ② Unloading area (large/small/distribution for processing), ③ Wholesale area (auction/distribution/transport), ④ Small-lot sorting (grouping by destination), ⑦ Small-lot parking lot (2nd floor, waiting for goods to be sorted), 8) Wholesale refrigerator (2nd to 4th floor, frozen fish storage), 9) Processing package (2nd to 3rd floor, seafood processing), etc. are divided into zones according to function.
- CAD layout blueprint:Berth placement, truck flow lines, equipment installation space, and aisle width are optimized down to the millimeter to improve work efficiency and reduce the risk of intersection accidents.
5.Consideration of storage/transportation method (example)
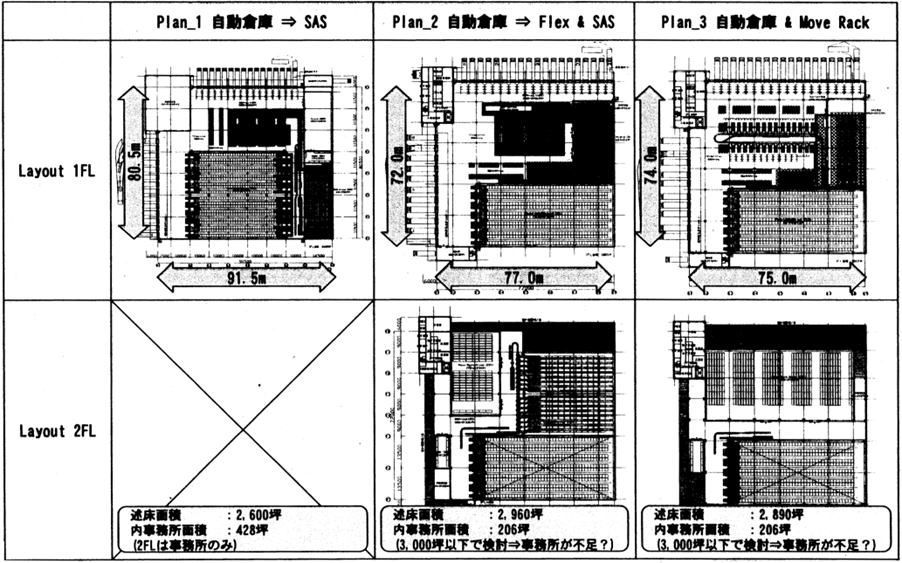
[Illustrated explanation]We are comparing and examining three layout plans (Plans 1 to 3) for architectural and facility planning in terms of length and width, total floor area, office area, etc.
- Plan 1 (automated warehouse ⇒ SAS):1st floor floor area: 80.5m x 91.5m (Total floor: 2,600 tsubo / Office: 428 tsubo / 2nd floor is office only).Equipment intensive.
- Plan 2 (Automated warehouse ⇒ Flex & SAS):1st floor floor area 72.0m x 77.0m (total floor area 2,960 tsubo/office 206 tsubo).A flexible storage area (Flex) is located on the second floor.
- Plan 3 (Automated warehouse & Move Rack):1st floor floor area 74.0m x 75.0m (total floor area 2,890 tsubo/office 206 tsubo).Improve storage efficiency by combining mobile racks.
6.Information system configuration diagram/operation/work explanation (example)
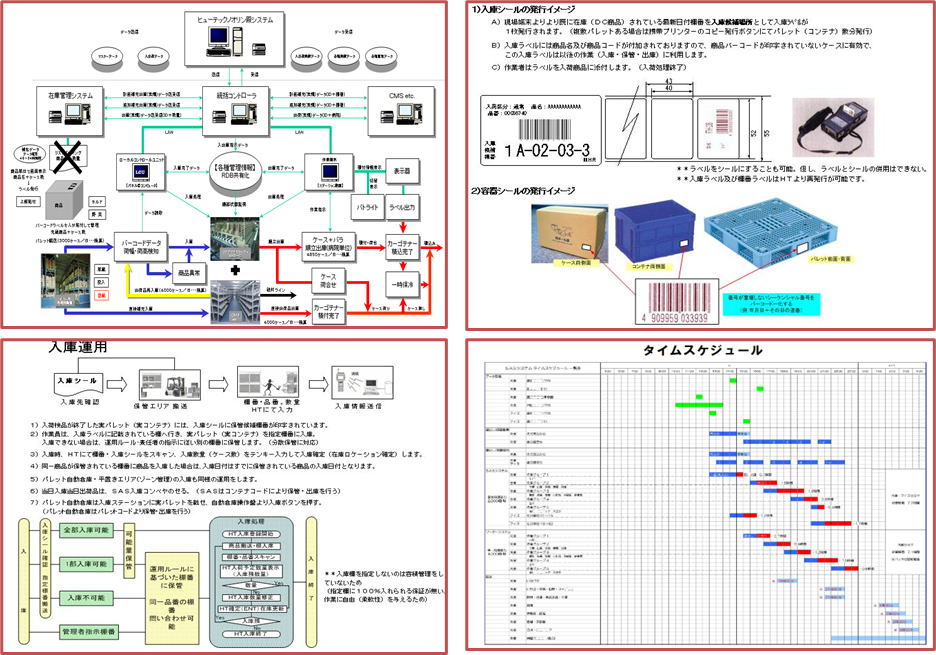
[Illustrated explanation]This is a diagram that summarizes the system configuration such as WMS and general controller, on-site warehousing terminal operation, and work time schedule on a time axis.
- System linkage configuration:Inventory management system, general controller, various display devices, barcode reader, label issuing machine, display device, etc. are linked in real time via LAN.
- Label issue image:1) Warehouse stickers (product code/barcode printed), 2) Container stickers (sequential barcodes for cases, containers, and pallets).
- Warehousing operation flow:Enter the shelf number, product, and quantity on the receiving terminal (HT) to confirm the inventory location.Flowchart of storage rules for pallet automated warehouses and flat storage areas.
- Time schedule:Accumulation and progress management of arrival, storage, picking, sorting, shipping inspection, and unloading work for each time period.
7.Explanation of reform (improvement) points and effects (example)
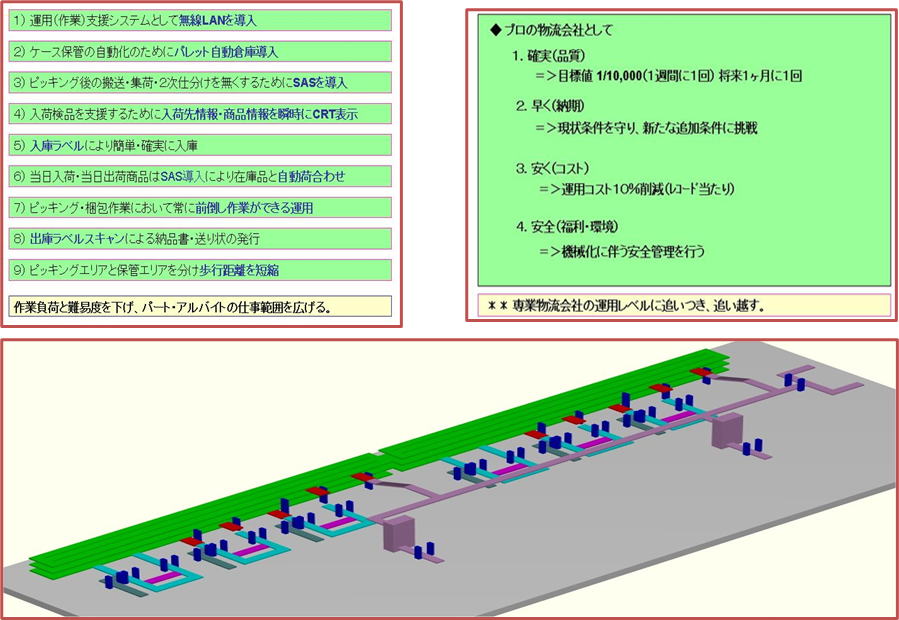
[Illustrated explanation]It shows specific measures by introducing new systems and automated equipment, as well as quantitative targets and a 3D transport line image as a professional logistics company.
- Main measures and improvement points:Introduction of wireless LAN, introduction of automatic pallet warehouse, abolishment of secondary sorting by introduction of SAS, immediate display of arrival information on CRT, shortening of walking distance, and simplification of part-time work.
- Four major effects to aim for (as a professional logistics company):
- Guaranteed (quality):Error target value: 1/10,000 (in the future, once a month or less).
- Early (Delivery date):Comply with current conditions and challenge new added conditions.
- Cheap (cost):10% reduction in operating costs (per record).
- Safety (welfare/environment):Thorough safety management associated with mechanization.
- 3D conveyor transfer line:An image of cooperation between a three-dimensional conveyor and automatic sorter that spans multiple floors and areas.
8.Explanation of investment amount and amortization (example)
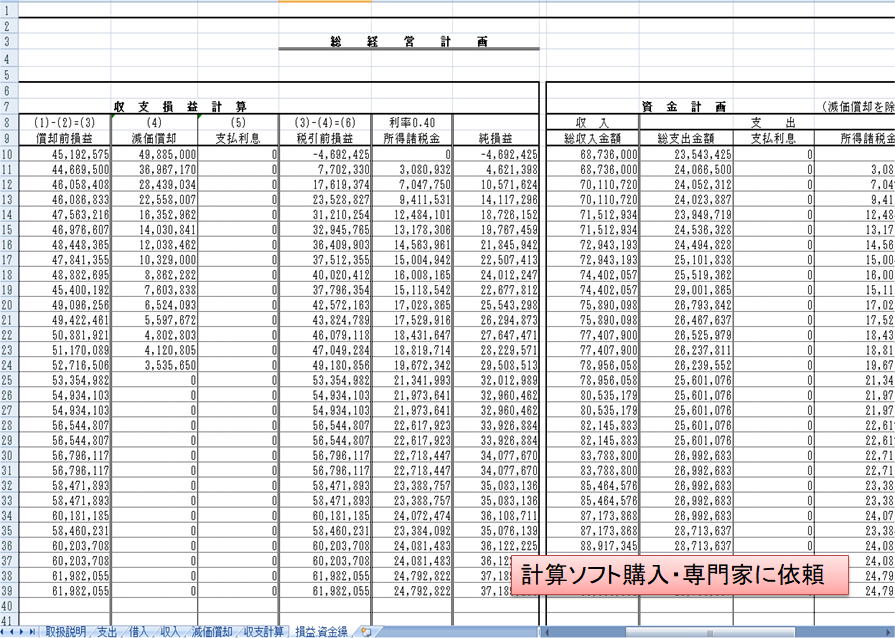
[Illustrated explanation]This is a total management plan sheet that simulates long-term (approximately 30 periods) "income and loss calculations" and "financial planning."
- Profit and loss calculation (profit and loss before amortization, depreciation, profit and loss before tax, net profit and loss):
- Due to the recording of depreciation expenses (49.88 million yen) compared to the first year's profit/loss before depreciation (45.19 million yen), the profit/loss before tax will temporarily be in the red (-4.69 million yen), but from the second year (profit/loss before tax 7.7 million yen/net profit/loss 4.62 million yen), it will quickly become profitable and profitable.
- Depreciation expenses decrease year by year (approximately 49.88 million yen in the first year → approximately 10.32 million yen in the 15th period → 0 yen from the 16th period onward), clearly indicating a structure in which investment recovery is progressing.
- Financial plan (total income/total expenditure):
- The plan is to manage the total expenditures (approximately 23.54 million yen to 28.71 million yen) in relation to the total income (approximately 68.73 million yen to 88.91 million yen) for each period, and to ensure stable cash flow (cash on hand) at all times.
- *For operation, we will purchase calculation software and ask an expert to accurately calculate and set conditions such as tax rate (0.40) and interest rate, and formulate a plan.