4-3. Explanation regarding data analysis and system construction
Logistics system design/EIQ analysis and PCB analysis simulation based on shipping data
1-I Basics of logistics system characteristics and data analysis
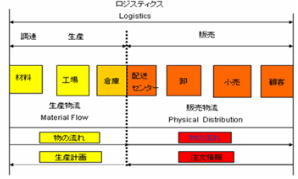
🔍 [Illustrated explanation] Differences in characteristics between production logistics and sales logistics
The diagram above shows the basic structure of the boundary between "procurement/production (production logistics)" and "sales (sales logistics)" in the entire supply chain.
- Production logistics (Material Flow):Logistics centered around factories and raw material warehouses.Since cargo is moved systematically based on the production plan, control is easy and demand fluctuations are relatively calm.
- Sales logistics (Physical Distribution):Logistics moves from distribution centers to wholesalers, retailers, and end users.Because it is directly influenced by the actual "order information," it is highly prone to small-scale production of a wide variety of products and sudden fluctuations in shipments.
distribution centerSystem constructionIn order to respond to these "irregular and irregular demands unique to sales logistics," wedata analysisis required.
The differences in characteristics between production logistics and sales logistics are extremely large.
What is a logistics system?
1.Complicated Low Technology
The correct answer is not just to line up sophisticated high-tech equipment; it is also necessary to optimize low-tech elements that involve complex intertwining of field work and IT.
2.System under multiple constraints
There are many correct answers to logistics optimization.Additionally, depending on changes in shipping volume and packaging conditions, a ``correct answer'' in one situation may become an ``incorrect answer'' in another, or vice versa.
Distribution center/logistics systemis a system with many constraints and many correct answers.
However, all designs"Basic system"must be built on.
The basic system here isSystem based on EIQ data and PCB analysisIt means.Because it is based on objective data, no matter who plans it logically, it will arrive at an optimal system that is consistent.Building systems based on random ideas that are not based on data is a major cause of failure.
1-II System approach (philosophy of way of thinking)
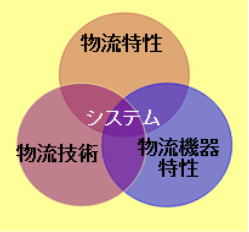
Systems Thinking
Rather than simply introducing the latest equipment, we should considerSystem constructionDo you want to do this?“Philosophy/way of thinking”is the most important.Students will be asked to think strategically about how to interpret and respond to the data they have collected in response to rapid economic trends and changes in the social environment.
💡 The true mission of the distribution center:
The distribution center's biggest mission is"Delivery of ordered items to customers by the specified date"That's all.Excessive automation, mechanization, and cost reduction are only means, not the purpose or mission itself.
Patterns from arrival to shipment and the importance of "PCB analysis"
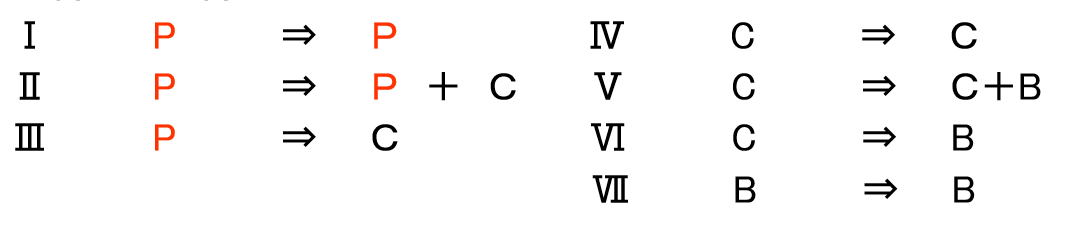
🔍 [Illustrated explanation] Transformation pattern of PCB analysis (P = pallet, C = case, B = rose)
The diagram above shows the changes (transformations) in packaging from when the package arrives at the warehouse until it is shipped.
- P (Pallet):Large-sized packaging in pallet units.
- C (Case):Inside packaging of a cardboard case.
- B (Bara/Piece):Small-lot packaging in units of individual pieces.
We developed a method to quantitatively understand the combination pattern of the form at the time of arrival (P/C/B) and the form at the time of shipment (P/C/B).PCB analysisIt is called.For example, a site with a high ratio of ``P in and B out (P ➔ B)'' requires a large breaking/piece picking area and a highly functional WMS, while a site with a high rate of ``C in and C out (C ➔ C)'' requires a cross-docking and sorter-based system.logistics systemwill be valid.
Selection of picking method
・Single Picking:A method in which one worker collects the ordered items for each order.
・Batch Picking:A method in which multiple orders are picked at once and then sorted by shipping destination.
*When using Batch Picking, it is necessary to design a secondary sorting system (sorter or assortment rack) after picking.
1-III Quantity and compatible logistics equipment (selection of compatible material handling)
(Original composition diagram by Shin Suzuki)
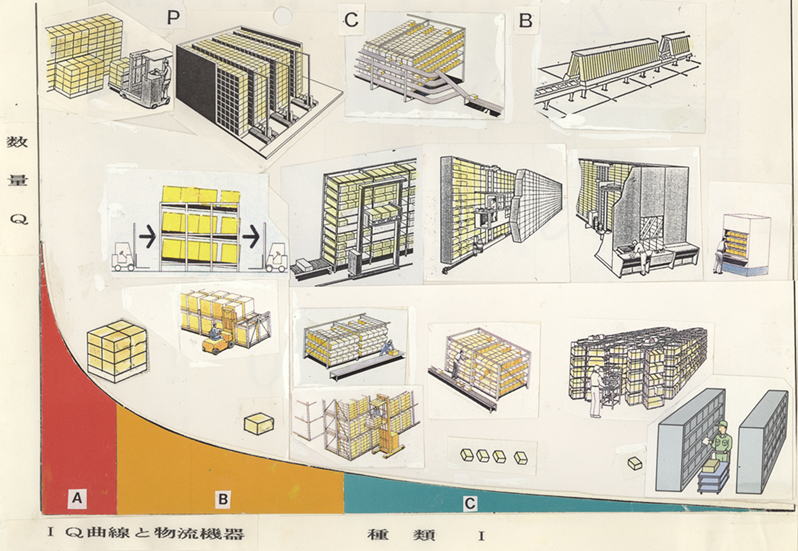
🔍 [Illustrated detailed explanation] Selection map of compatible logistics equipment according to IQ curve and PCB (packing form)
This diagram isdata analysis(IQ analysis andPCB analysis) From the data on "shipment quantity (Q)", "number of types (I)", and "packing style (P/C/B)", we will determine the optimal one to introduce.logistics system・This is a system diagram for deriving storage material handling.
- A rank (high flow/mass shipping zone):
This is an area where shipping is concentrated.Automation and mechanization equipment such as automatic pallet warehouses, mini-load case automatic warehouses, A-type automatic Pic machines, and high-speed sorters are centrally located to achieve high throughput processing. - B rank (medium flow zone):
We select equipment that balances storage efficiency and picking workability, such as reach forklifts + pallet racks, bucket shelves, and carousels (rotating shelves). - C rank (low flow/high variety small volume zone):
Although the number of SKUs is huge, the amount shipped per item is very small.By avoiding the introduction of expensive automated equipment and adopting low-tech operations using fixed medium-duty shelves and push trolley carts, we avoid over-investment and optimize overall ROI.
1-IV How to view data and how to position data
data analysisWhen doing this, the most common trap to fall into is to treat one day's worth of data as standard values for the entire company.
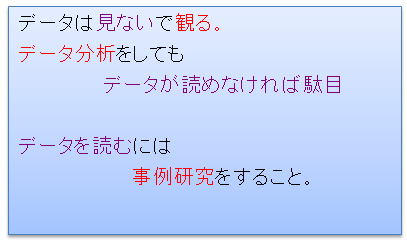
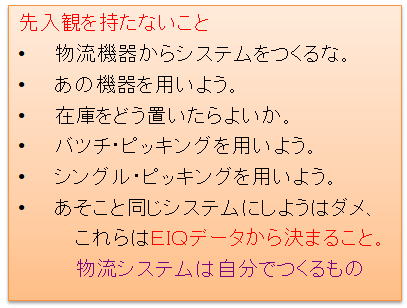
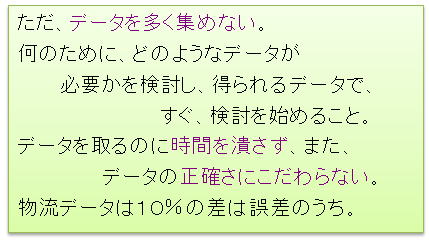
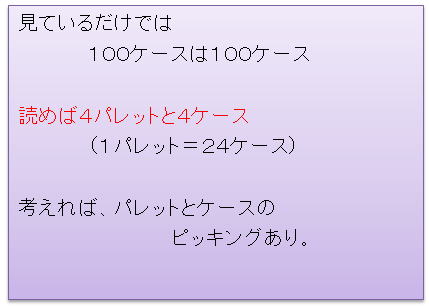
🔍 [Illustrated explanation] 4 tips for successful data analysis (slide explanation)
- “Watch” without looking at the data (image220.jpg):Rather than simply looking at numbers, we observe and decipher the background movements at the site.By studying case studies of other companies, you will gain deeper insight into the meaning of the numbers.
- Without preconceptions (image225.jpg):We eliminate equipment-oriented thinking such as "I want to use that equipment" or "I want to use the same equipment as other companies."logistics systemis independently constructed based on EIQ data.
- Do not collect a lot of data - 10% difference is an error (image226_2.jpg):Don't get too caught up in precision, narrow down to only the necessary data and quickly start considering it.A fluctuation of around 10% in logistics data is considered to be within the margin of error, and the priority is to quickly grasp the overall trend [cite: 1].
- Reading data on packaging (PCB) (image227.jpg):The number ``100 cases'' can be read as ``4 pallets + 4 cases'' if 1 pallet = 24 cases.PCB analysisBy having this perspective, you can see the specific workload of actual pallet handling and case picking.
Relative position of survey date (understand maximum and average)
“Where does the specific daily quantity that we analyzed fall in relation to the annual maximum and average values?”If you don't understand the exactSystem constructionis not possible.
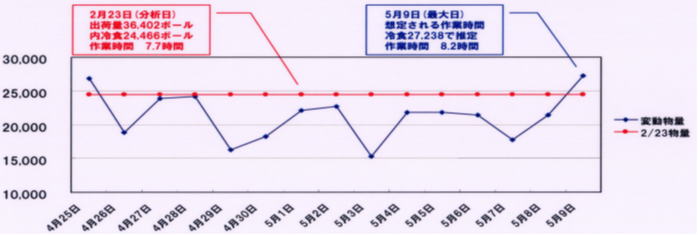
🔍 [Illustrated explanation] Fluctuation comparison analysis between analysis date (2/23) and maximum day (5/9) (image228.jpg)
The above figure shows the quantity on the specific analysis date (February 23rd) and the daily quantity fluctuation graph during the subsequent production period (April 25th to May 9th).
- Data on analysis date (2/23):Shipment amount: 36,402 balls (including 24,466 balls of frozen food), working time: 7.7 hours.It is shown as a red reference line (24,466 balls) on the graph.
- Data for maximum day (5/9):The amount of frozen food shipped reached 27,238 balls, and the estimated working time jumped to 8.2 hours.
Practical insights:If you design the system capacity and regular personnel according to the reference quantity (24,466 balls) on the analysis day (2/23), it will be possible to increase the amount on a peak day like May 9th (27,238 balls).logistics systemwill get a flat tire.When evaluating analytical data, it is essential to understand where the reference date is relative to the annual peak, and to factor in equipment buffers and personnel shifts (overtime and temporary staffing) that can cover the maximum day (8.2 hours of operation).
Analysis of data file field definitions and operational rules

🔍 [Illustrated explanation] Data field definition and picking/packing logic (image229.jpg)
The above figure shows an example of the structure of shipping transaction data extracted from a WMS (warehouse management system) and the definition of its operational rules.
- Main fields:Shipping date, shipper management department, agency (orderer), shipping destination (End Customer), order number, shipping number, product number/name (Inventory Item Code), lot number, serial number, shipping quantity, etc. are defined.
- Picking and bundling rules (text at the bottom of the image):
① “Pick the Inventory Item Code for each End Customer Number, read the Lot Number and Serial Number of the picked item, and add it to the shipping information.”
② "Products picked by End Customer Number will be bundled and shipped by destination."
Practical insights: System constructionIn this case, it is necessary to decipher not only the numerical data of ``what and how many items to send'' but also the logic of ``which unit (end customer) should be picked and at what stage should name identification and packaging be carried out?'' from the data structure.By clarifying the SKU (minimum inventory management unit) and packaging unit, you can accurately design the required number of packaging units and the operation flow of the barcode scanner.
2-Ⅰ~Ⅳ Overview and purpose of EIQ analysis
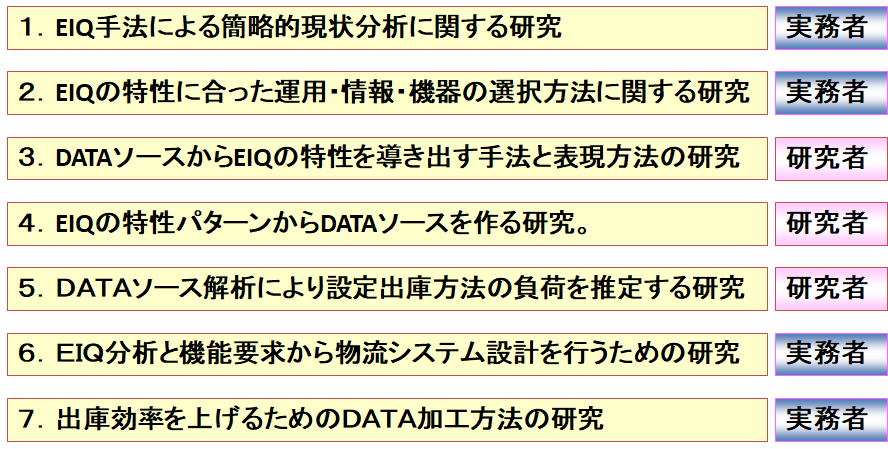
🔍 [Illustrated explanation] Seven approaches to EIQ research and the roles of practitioners and researchers (image230.jpg)
The diagram above shows an overview of the seven research themes related to the EIQ method and the definition of whether "practitioners" or "researchers" should be responsible for each.
- Themes led by practitioners (on-site operation/system construction):
1. Research on simple current situation analysis using EIQ method
2. Research on how to select operations, information, and equipment that match the characteristics of EIQ
6. From EIQ analysis and functional requirementslogistics systemResearch for designing
7. Research on DATA processing methods to increase shipping efficiency [cite: 1] - Themes led by researchers (theoretical models and data conversion):
3. Research on methods and expression methods for deriving EIQ characteristics from DATA sources
4. Research on creating DATA sources from EIQ characteristic patterns
5. Research on estimating the load of the set shipping method using DATA source analysis
Practical insights:on-siteSystem constructionThe key to success for practitioners in charge of this is to focus on ``what kind of material handling equipment and operations should be selected and designed based on the shipping characteristics obtained from EIQ data (Themes 2 and 6),'' rather than simply chasing the aggregation logic (researcher's domain).
EIQ analysis program and basic steps
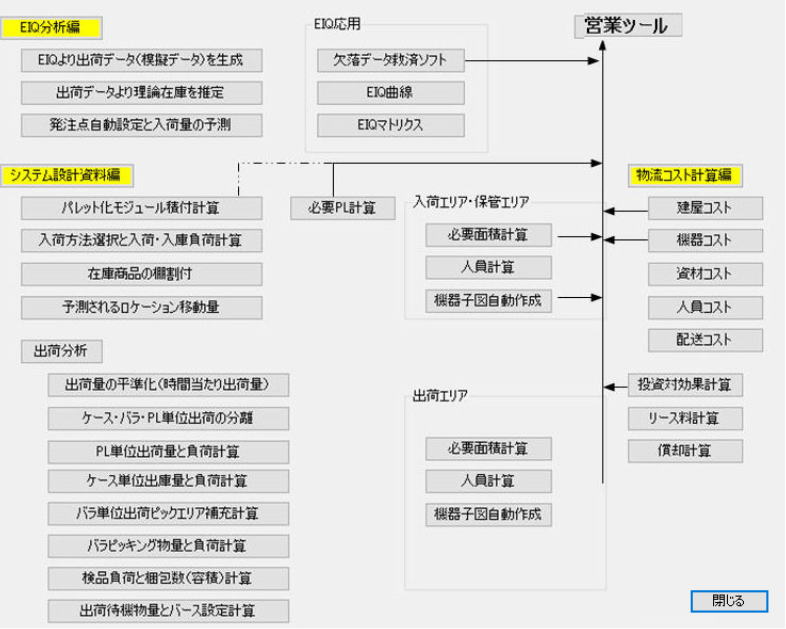
🔍 [Illustrated detailed explanation] Linked flow from data analysis to system design and logistics cost calculation (image234.jpg)
The diagram above shows a system that uses EIQ analysis data as a starting point to simulate everything from distribution center space and cargo handling design to final investment cost calculation.
- EIQ analysis/EIQ application:It predicts theoretical inventory, order points, and arrival quantities from EIQ data, and automatically outputs missing data and EIQ matrices and curves.
- System design materials (shipping analysis/cargo handling design):Equalization of shipping volume per hour, separation of cases, individual units, and PL units (PCB analysis), cargo handling load calculations for receiving, shipping, replenishment, and bulk picking, and settings for inspection, number of packages, and number of berths.
- Physical area design (incoming, storage, and shipping areas):From the required number of PL, we calculate the required area for receiving, storage, and shipping areas, calculate the number of workers, and automatically create equipment layout drawings.
- Logistics cost calculation edition (sales tools):We aggregate building, equipment, materials, personnel, and delivery costs and simulate return on investment (ROI), lease fees, and depreciation costs.
Practical insights:excellentdata analysisRather than being satisfied with report creation, as shown in the diagram, we automatically link the calculations of ``physical area required (storage and shipping)'', ``required personnel'', ``material handling equipment'', and ``ROI/logistics costs''.System constructionIt shows its true value only when it is used as a foundation for the future.






🔍 [Illustrated explanation] 6 issues revealed by EIQ analysis
EIQ analysis provides quantitative answers to the following questions:
- What kind of storage equipment (pallet racks, case shelves, automated warehouses) is required?
- Is the picking method single picking or batch sowing?
- What kind of layout flow line can shorten walking distance the most?
- What kind of material handling equipment (conveyor, sorter, AGV) should be introduced?
- What is the optimal staffing arrangement according to the time period fluctuations of shipping operations?
- To what extent will the system be able to withstand future volume growth?
2-Ⅴ~Ⅶ How to read EIQ index and necessary data
1. Ratio of number of items (I analysis):Percentage of SKUs that are actually in operation (shipped) out of all SKUs.
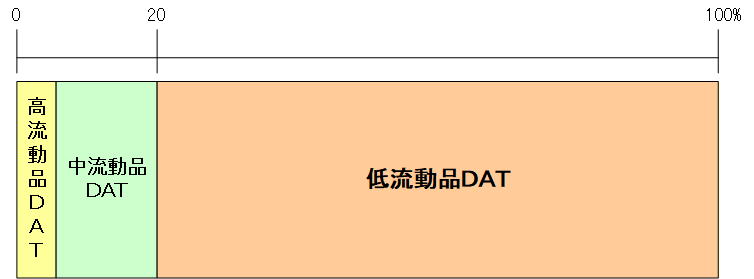
2. Quantity ratio (Q analysis):Concentration of shipment quantity (Pareto's law: Do the top 20% of products account for 80% of the total quantity?)
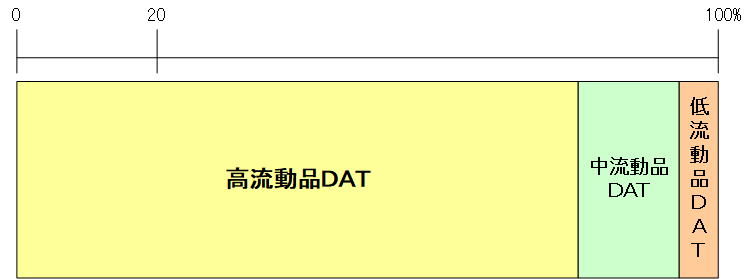
3. Ratio of number of destinations (E-analysis):Bias in order frequency and number of units for each delivery destination (customer).
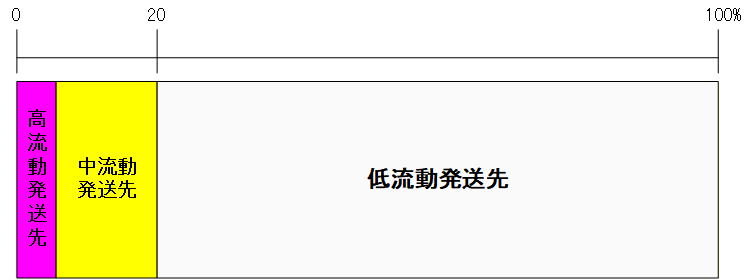
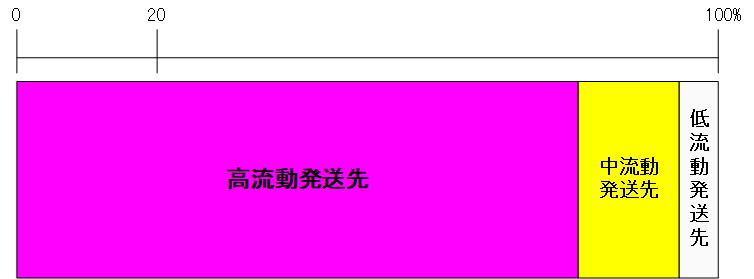
4. Shipping volume ratio (EQ analysis):Shipping volume per delivery destination (large shipments or small shipments frequently).
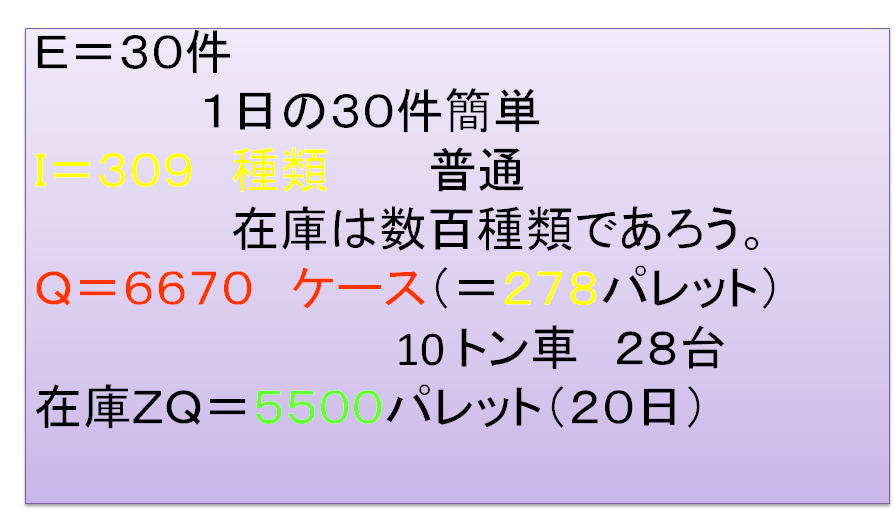

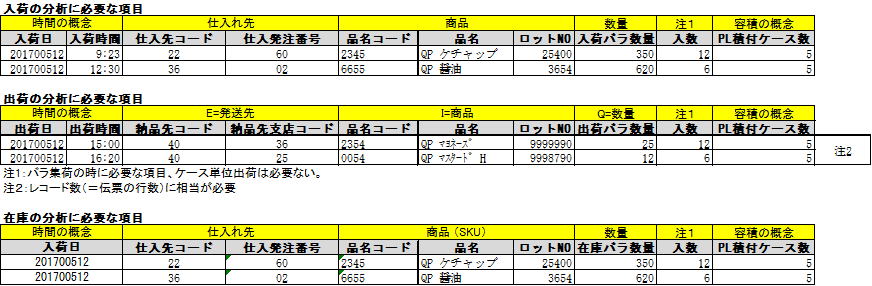
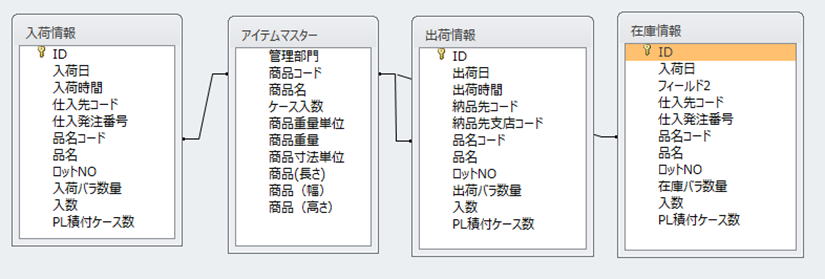
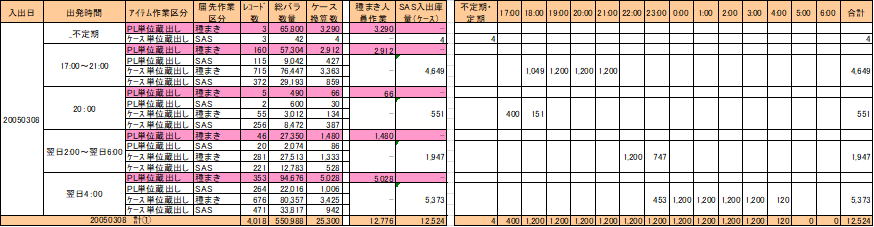
Investigation items required for EIQ analysis and PCB analysis

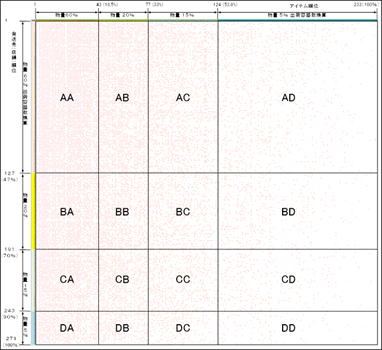
2-VIII~IX EIQ matrix and its application to layout design
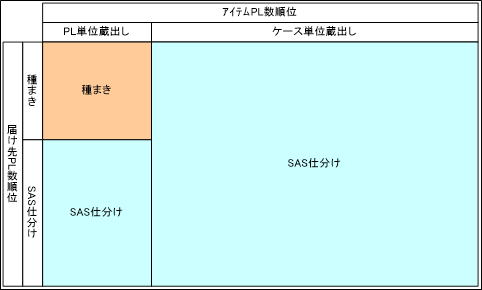
Linking analysis results to layout diagrams (space design)
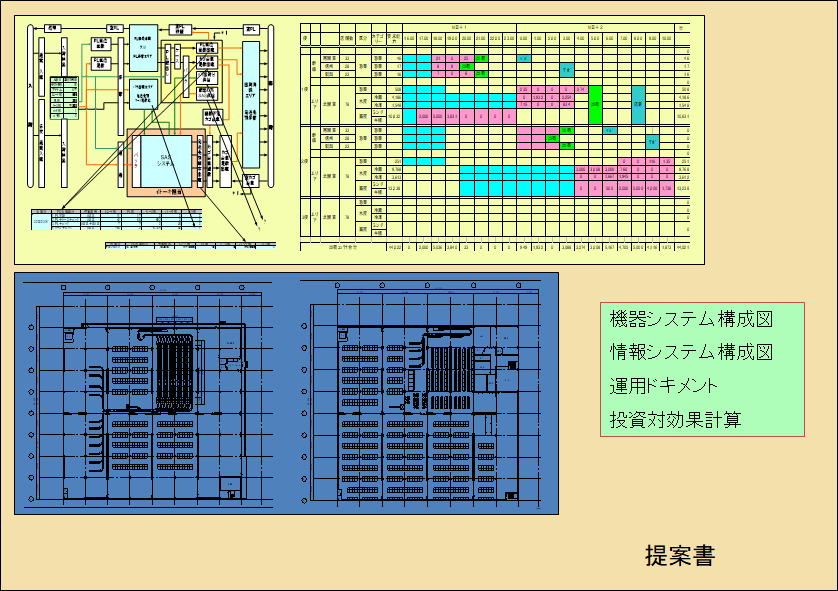
🔍 [Illustrated explanation] Returning data analysis (EIQ/PCB) to layout
data analysisThe final goal is not to create an analysis report, but to translate it into an actual "distribution center layout diagram (spatial layout)."
- High flow zone (A rank × case/pallet packaging):Place it near the shipping port and connect it directly to a forklift or automatic sorter.
- Medium flow zone (B rank x bulk packaging):Medium-sized shelves and a digital picking system (DPS) are installed to optimize walking lines.
- Low flow zone (C rank × long-term storage):It is placed at the back of the warehouse or on a high-rise mezzanine floor to maximize tsubo efficiency (space utilization rate).
In this way,data analysis、PCB analysis、EIQ analysisBy going through a series of steps, the ideallogistics systemconstruction is complete.