3-7. Methods and utilization of logistics analysis in logistics facility planning
In order to gain an advantage over competitors and build a lean supply chain, we need objective, data-driven methods that do not rely on intuition or experience.Logistics facility planningis essential.
When building a new center or reorganizing an existing base, simply building a large warehouse will not be successful.Until the package is delivered to the customerlead time``Delivery convenience,'' which is how much time can be shortened, and ``transportation convenience,'' such as access for large trucks and proximity to expressway ICs.Location conditions”, and to maintain stable warehouse operations over the long term.employment locationIt is necessary to analyze and consider these three perspectives from multiple angles:
In this article, shippinglead timeMinimization and optimalLocationWe will explain in detail the logistics data analysis method that makes selection possible, as well as specific steps to use it.
1.Background and role of DATA analysis
Quantitative data analysis is essential in designing logistics centers and reorganizing locations.Logistics facility planningThis will be the starting point.without data analysisLocationDeciding on the size and size of the project may cause unexpected increases in costs and work delays.
1-1.Why is DATA analysis necessary?
The main purpose of analyzing logistics data is not only to improve work efficiency in the warehouse, but also to analyze the most advantageous things for your company.Location conditionsThe goal is to identify the issues and make efficient capital investments.
For example, by analyzing shipping data, you can visualize the regional bias of customers and the frequency of orders.This allows for the “averagelead timeThe optimalLocationThe area will automatically be narrowed down.In addition, by understanding the work fluctuations for each time period, it is possible to accurately estimate the number of part-time workers required, and it is possible to accurately calculate the number of part-time workers required.employment locationIt is also used as an evaluation index.

1-2.Who performs DATA analysis?
Ideally, analysis should be carried out by a "project team" that includes not only on-site work managers, but also business planning, sales, IT departments, and external 3PL operators and consultants."Ease of operation" from a field perspective and "ease of operation" from a management perspective.LocationSatisfies both return on investment (ROI)Logistics facility planningThis is to formulate the.

1-3.When should DATA analysis be performed?
Starting up a new base orLocationThis is carried out not only during the "initial concept phase" when making selections, but also on a continuous basis during periodic reviews (business improvement phase).Flexible as customer demand changeslead timeReviewing logistics and operations will help maintain a sustainable logistics system.

1-4.Information required for DATA analysis

1-5.Knowledge and tools required for DATA analysis
2.DATA analysis method and specific analysis procedure
Logistics facility planningThe main ones are "ABC analysis" and "EIQ analysis".These allow us to determine the warehouse layout, the necessary base size, and even the optimalLocationThe environment is logically derived.
1) ABC analysis
The best way to think about it is to arrange each item in descending order of the amount of stock and issue, and divide them into three groups: A (high flow), B (medium flow), and C (low flow).ABC analysis(Mainly used for sales analysis by item and evaluation of storage efficiency).
■ Utilization in logistics facility planning:By placing A-rank products that are shipped extremely frequently near the shipping port (shortest flow line), picking time in the warehouse can be reduced, and the internal process from ordering to shipping can be reduced.lead timecan be dramatically shortened.
Analysis procedure
- Sort products by sales amount or quantity issued.
- Calculate the overall total of issue quantities.
- Calculate the composition ratio (what percentage of the total does each product account for)?
- The cumulative value of the composition ratio is calculated.
- Create a graph with the cumulative composition ratio (%) on the vertical axis and the product name (SKU) on the horizontal axis.
- Draw the trajectory of the cumulative composition ratio as a line graph (Pareto chart).
- The cumulative composition ratio is70% (A rank), 90% (B rank), 100% (C rank)Divide into groups at boundaries.
- Allocate storage equipment (automated warehouses, flow racks, etc.) according to product characteristics for each rank.
2) EIQ analysis
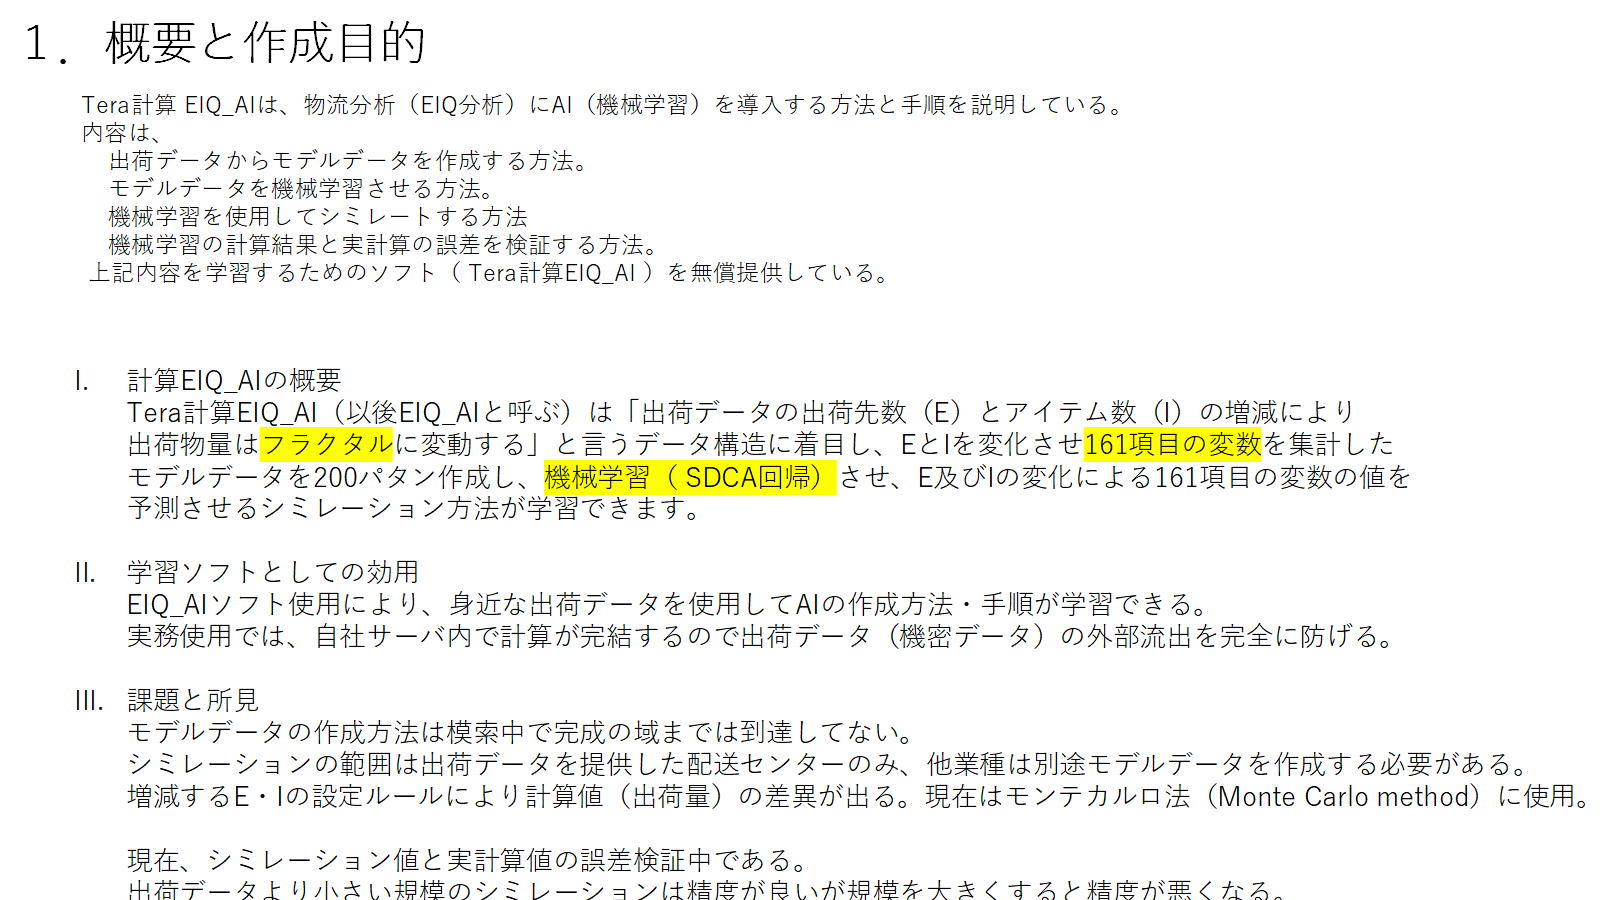
EIQ analysis (Entry Order, Item, Quantity)is a method that analyzes the characteristics of a distribution center from multiple angles based on the interrelationships between the number of orders (E), items (I), and shipment quantities (Q).
It is used as a criterion for determining whether the picking method should be ``single order picking (individual parcels)'' or ``intensive picking and seeding method.''
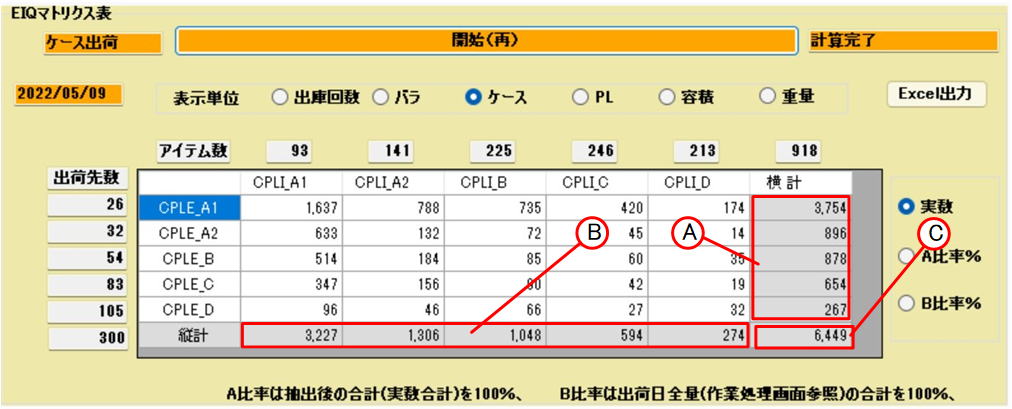
Order quantities are written in a matrix with items arranged in descending order of number of shipments on the vertical axis and shipping destinations arranged in descending order of order lines on the horizontal axis, and the optimal work system is selected based on the distribution density.
Analysis summary results are output in EIQ matrix table (TCalc 1)
2-2.Relationship between understanding shipping characteristics and delivery efficiency
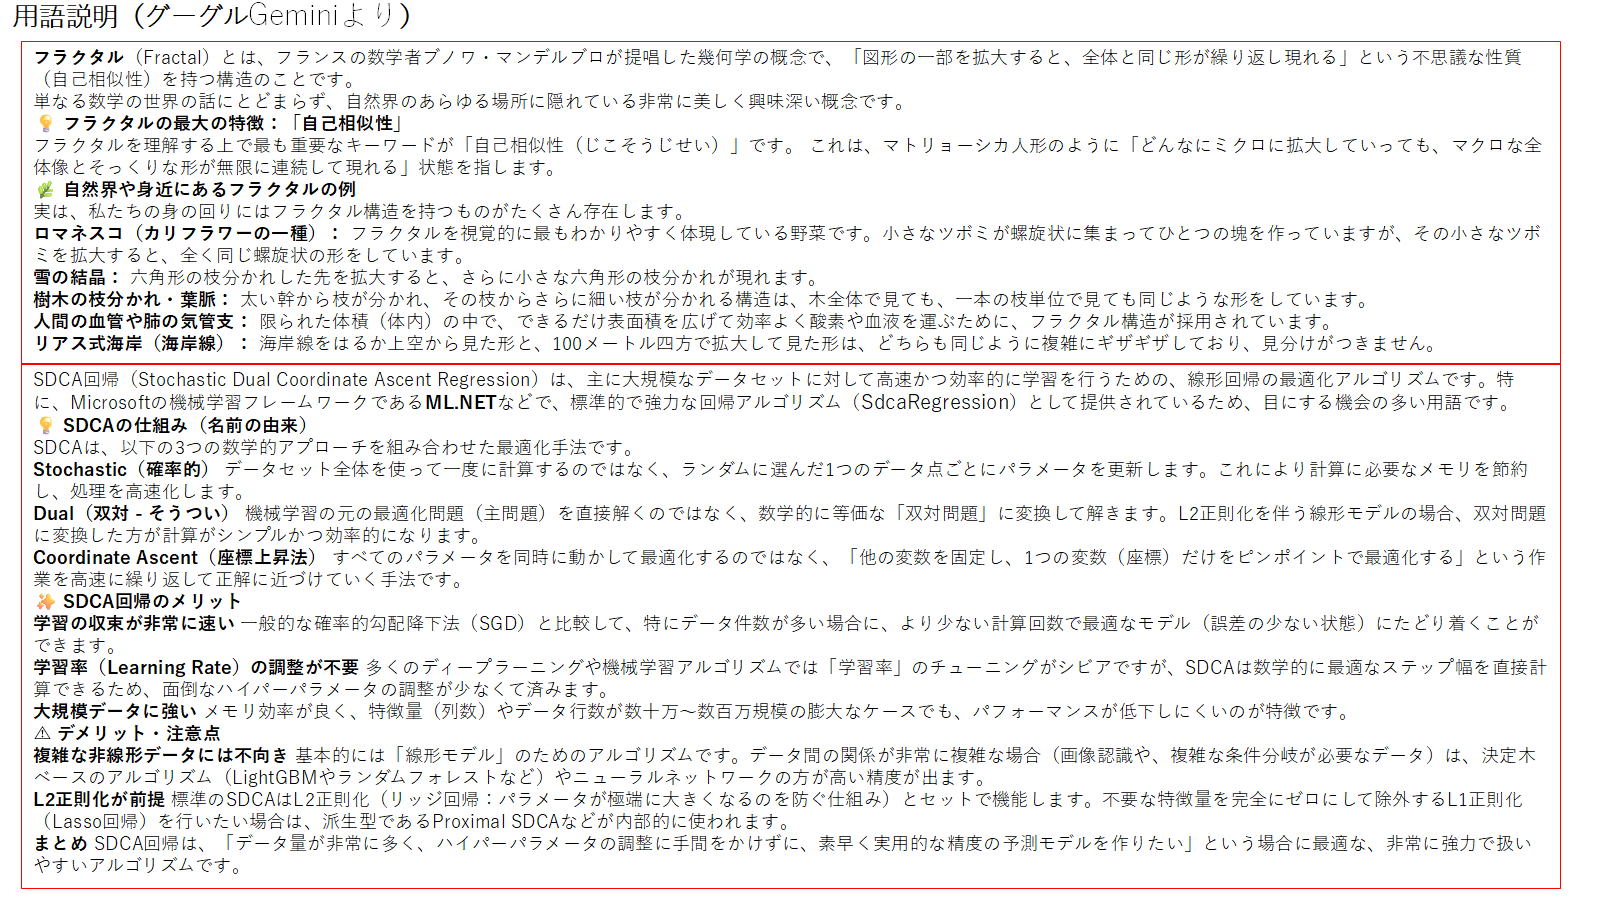
What can be achieved depends on the extent to which customers and the field understand the company's "shipping characteristics."lead timeThe width of the shortening is determined.[cite: 12] By quantifying the concentration of shipments (peak waves) in each time period, it is possible to eliminate waiting times for trucks and enable smooth delivery.[cite: 12]
2-3.Three elements of EIQ analysis and applications
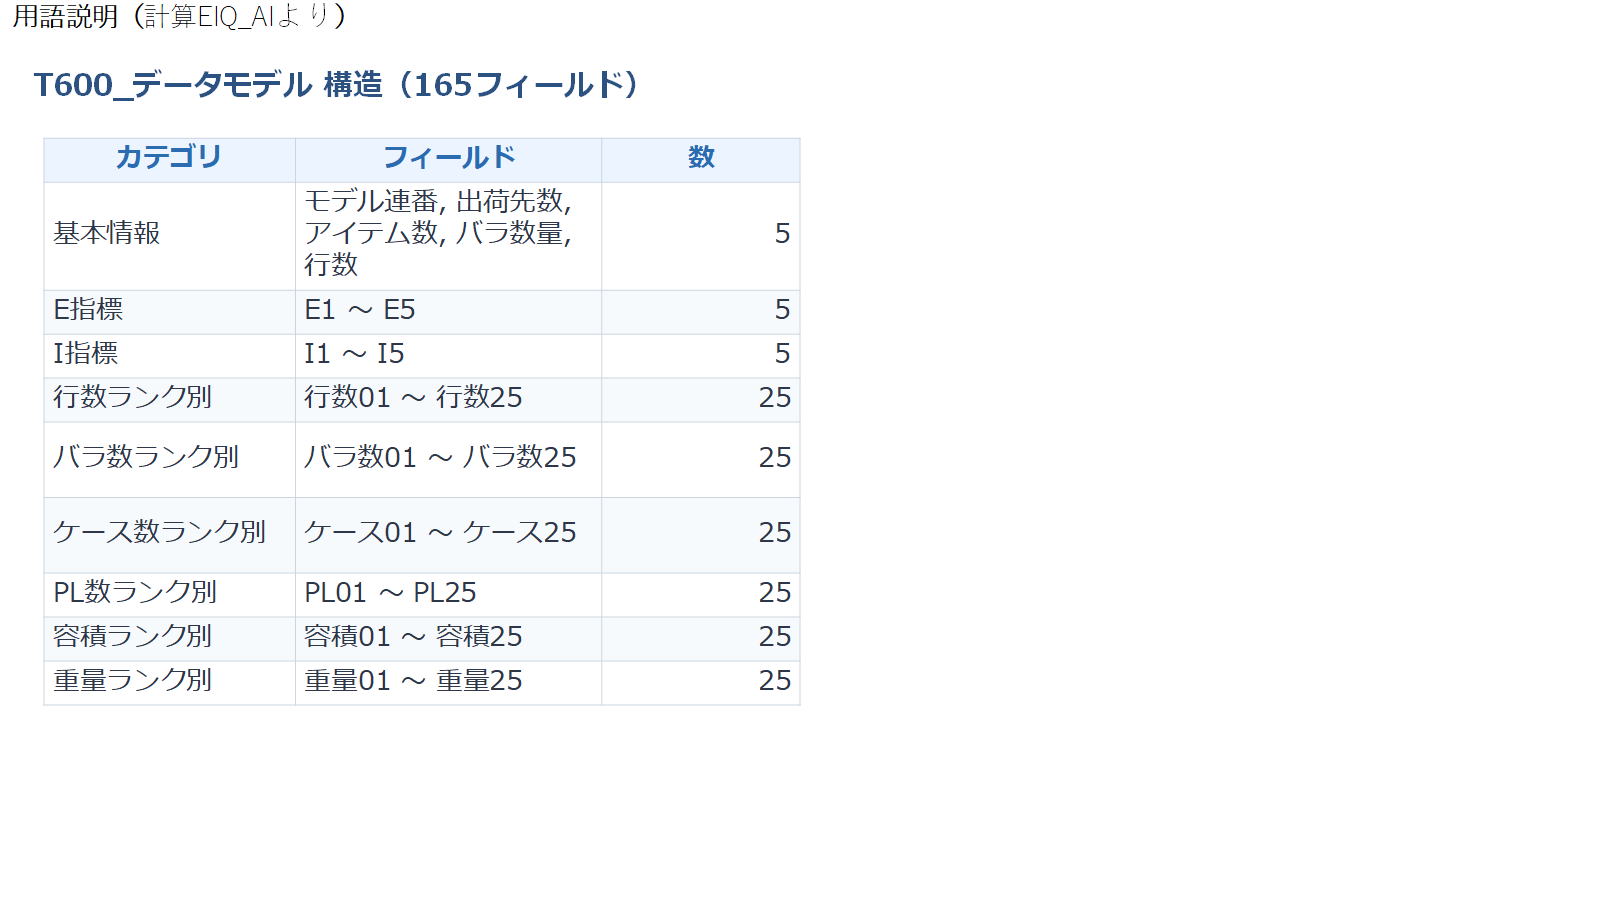
1) Components of EIQ analysis
The EIQ method was developed by logistics consultant Shin Suzuki and is based on the following three key factors, which are the basics of logistics:
- E (Entry/Order):Number of orders (number of purchase orders/orders).Indicates the number of delivery destinations and order details.
- I (Item):Number of types (number of items/number of SKUs handled).This is directly related to the storage space and number of locations required.
- Q (Quantity):Quantity (number of items shipped/total volume).This serves as the basis for the processing capacity of transport equipment and the number of trucks to be arranged.
* Also indicates the shape, dimensions, and weight of the product.S (Size/Shape)By performing "SEIQ analysis" that includes the following, it is possible to select storage and cargo handling equipment more precisely.
2) Visualization using EIQ graphs and scatter diagrams
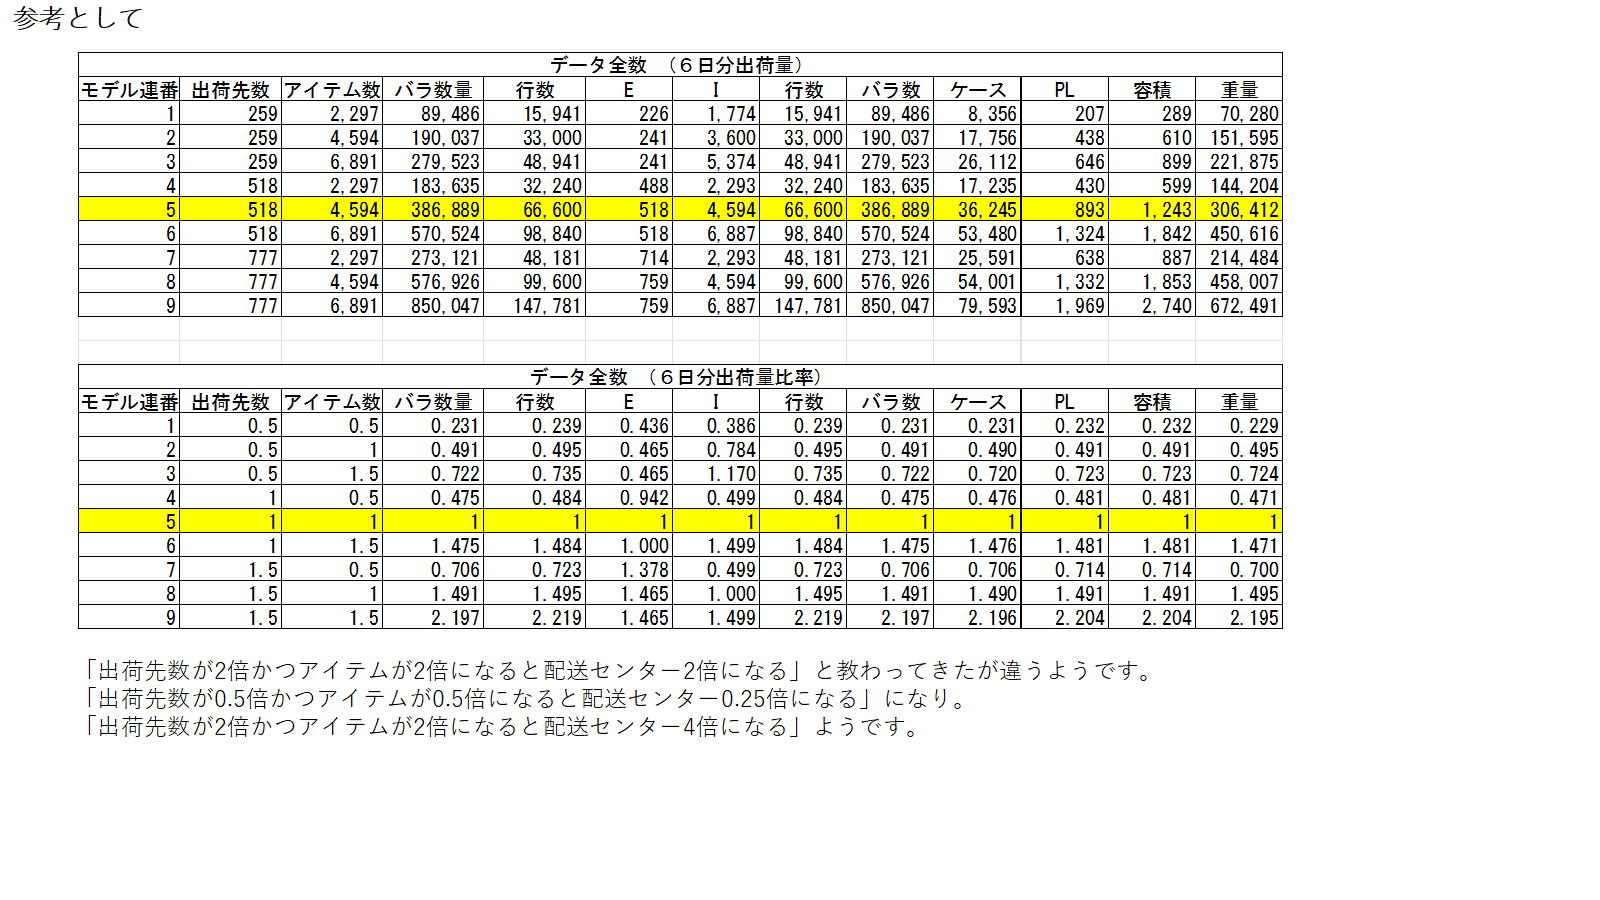
By using a scatter plot, you can visually understand numerical values in data as a "distribution."By understanding where large orders are concentrated and when small bulk shipments increase, you can make optimal staff allocation.
2-4.Utilization of EIQ scatter plot
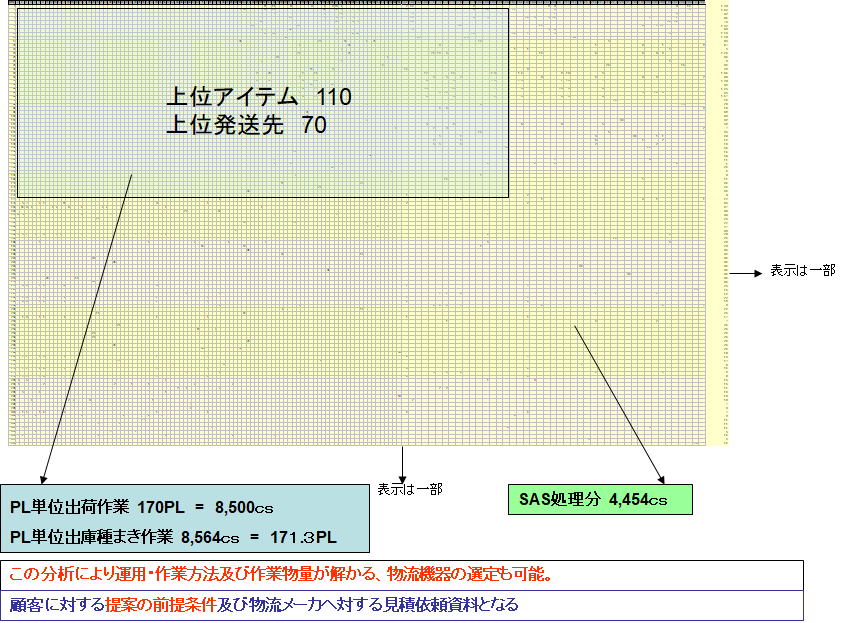
2-5.Current status survey sheet for logistics planning
Logistics facility planningIn order to succeed, it is necessary not only to analyze the data but also to:Location conditionsoremployment locationIt is essential to comprehensively investigate qualitative and quantitative information related to
📦 Inventory/storage characteristics
- Number of registered items (number of master registrations)
- Number of actual inventory items (number of always-on items)
- Average/Maximum inventory (case/piece)
- Storage format (pallet, case, individual)
- Seasonal inventory fluctuation range (space required during peak hours)
🚚 Shipping/location conditions (delivery access)
- Shipping unit (pallet, case, bulk)
- Number of destinations delivered per day and regional distribution
- Arrival at major customerslead time(Same-day/next-day delivery, etc.) [cite: 12]
- Truck model (large/medium) and number of trucks
- Traffic from expressway ICs and main roadsLocation conditions」
👥 Work system/employment location
- Working hours (presence of early morning/night shifts)
- Required number of personnel (total working hours per day)
- Surrounding population and public transportation (employment locationease of securing)
- Hiring price for part-time workers (regional wage level)
💻 Information systems & operational collaboration
- Order closing time and timing of shipping instructions
- Presence of WMS (warehouse management system) and location management
- Inspection method (handy terminal, image inspection, etc.)
- Real-time delivery tracking (traceability)