3-7. Logistics Analysis Methods & Application in Facility Planning
To establish competitive advantage and build lean supply chains, objective, data-driven logistics facility planning that eliminates reliance on guesswork or intuition is essential.
When launching new centers or restructuring existing networks, building a large warehouse alone does not guarantee success. Planners must evaluate three core pillars: delivery lead time reduction to customer destinations, optimal location conditions (heavy truck accessibility and highway IC proximity), and labor location availability to secure long-term warehouse staffing.
This article details data analysis techniques and practical application workflows designed to minimize delivery lead times and identify optimal site locations.
1. DATA Analysis Background & Strategic Roles
Quantitative data analytics serves as the foundational starting point for all logistics facility planning. Selecting site locations or facility dimensions without analytical backing leads to cost inflation and operational delays.
1-1. Why DATA Analytics is Essential
The primary goal of logistics data analysis extends beyond warehouse floor optimization—it identifies superior location conditions to maximize capital investment efficiency.
Analyzing shipping records visualizes geographic customer density and order generation frequencies. This narrows optimal site location candidates that simultaneously achieve average lead time reductions and lower freight transport costs. Furthermore, modeling hourly operational waves enables precise staffing forecasts for part-time labor, serving as a key benchmark for evaluating labor location availability.

1-2. Who Conducts DATA Analytics?
Data analytics is best executed by a cross-functional project team—combining warehouse floor managers, corporate planning, sales, IT departments, and external 3PL partners or consultants. This ensures logistics facility planning satisfies both operational floor usability and executive Return on Investment (ROI) targets for the chosen site location.

1-3. When to Perform DATA Analytics
Analytics must be performed during initial conceptual phases when evaluating new site locations, as well as during ongoing operational review cycles. Continuously refining lead times and warehouse workflows in response to shifting customer demand maintains supply chain resilience.

1-4. Information Required for DATA Analytics

1-5. Knowledge & Tools Required for DATA Analytics
2. DATA Analytical Methodologies & Execution Workflows
ABC Analysis and EIQ Analysis represent the primary analytical frameworks in logistics facility planning, logically deriving internal warehouse layouts, required hub dimensions, and optimal site location environments.
1) ABC Analysis
ABC Analysis ranks individual inventory items by stock or shipment volume, categorizing SKUs into three velocity groups: Group A (High Velocity), Group B (Medium Velocity), and Group C (Low Velocity). Primarily used for SKU sales velocity analysis and storage density optimization.
■ Application in Facility Planning: Staging Rank-A SKUs near outbound shipping docks (shortest travel paths) minimizes internal picking travel time, dramatically reducing order-to-shipment internal lead times.
Analytical Execution Steps
- Sort all SKUs in descending order by sales value or shipped volume.
- Calculate total aggregate shipped volume across all items.
- Determine the volume percentage share for each individual SKU.
- Calculate cumulative percentage totals across the sorted SKU list.
- Plot a Pareto chart with cumulative percentage on the vertical axis and SKU count on the horizontal axis.
- Draw the cumulative velocity curve (Pareto distribution curve).
- Divide SKUs into velocity tiers at cumulative thresholds: 70% (Rank A), 90% (Rank B), and 100% (Rank C).
- Assign proper storage equipment (e.g., automated high-bays, flow racks) based on tier characteristics.
2) EIQ Analysis
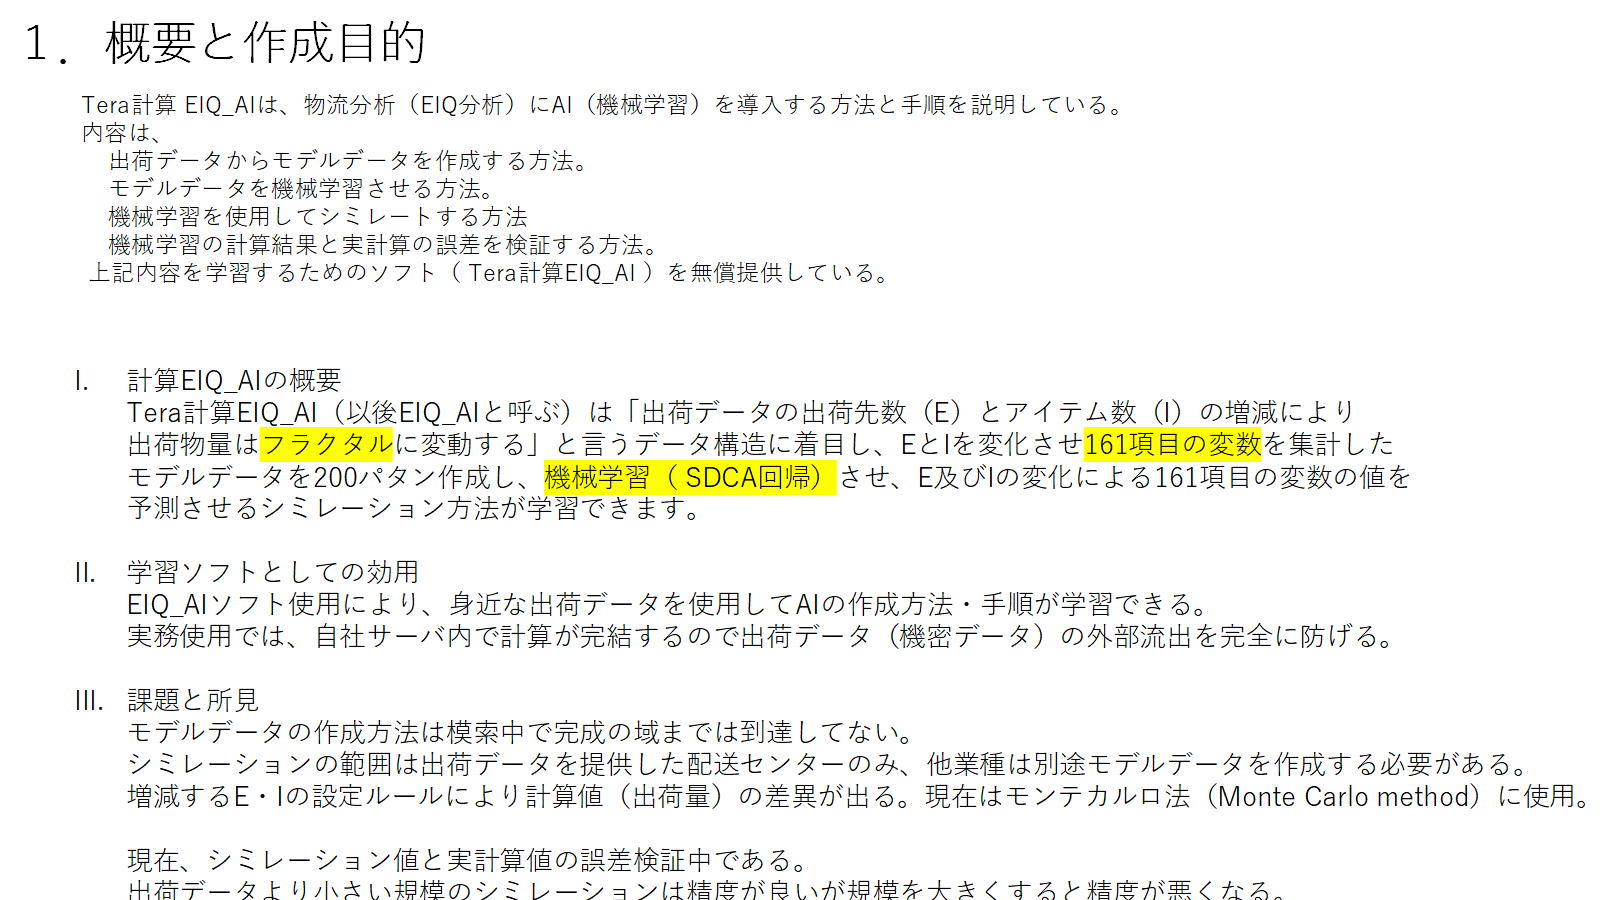
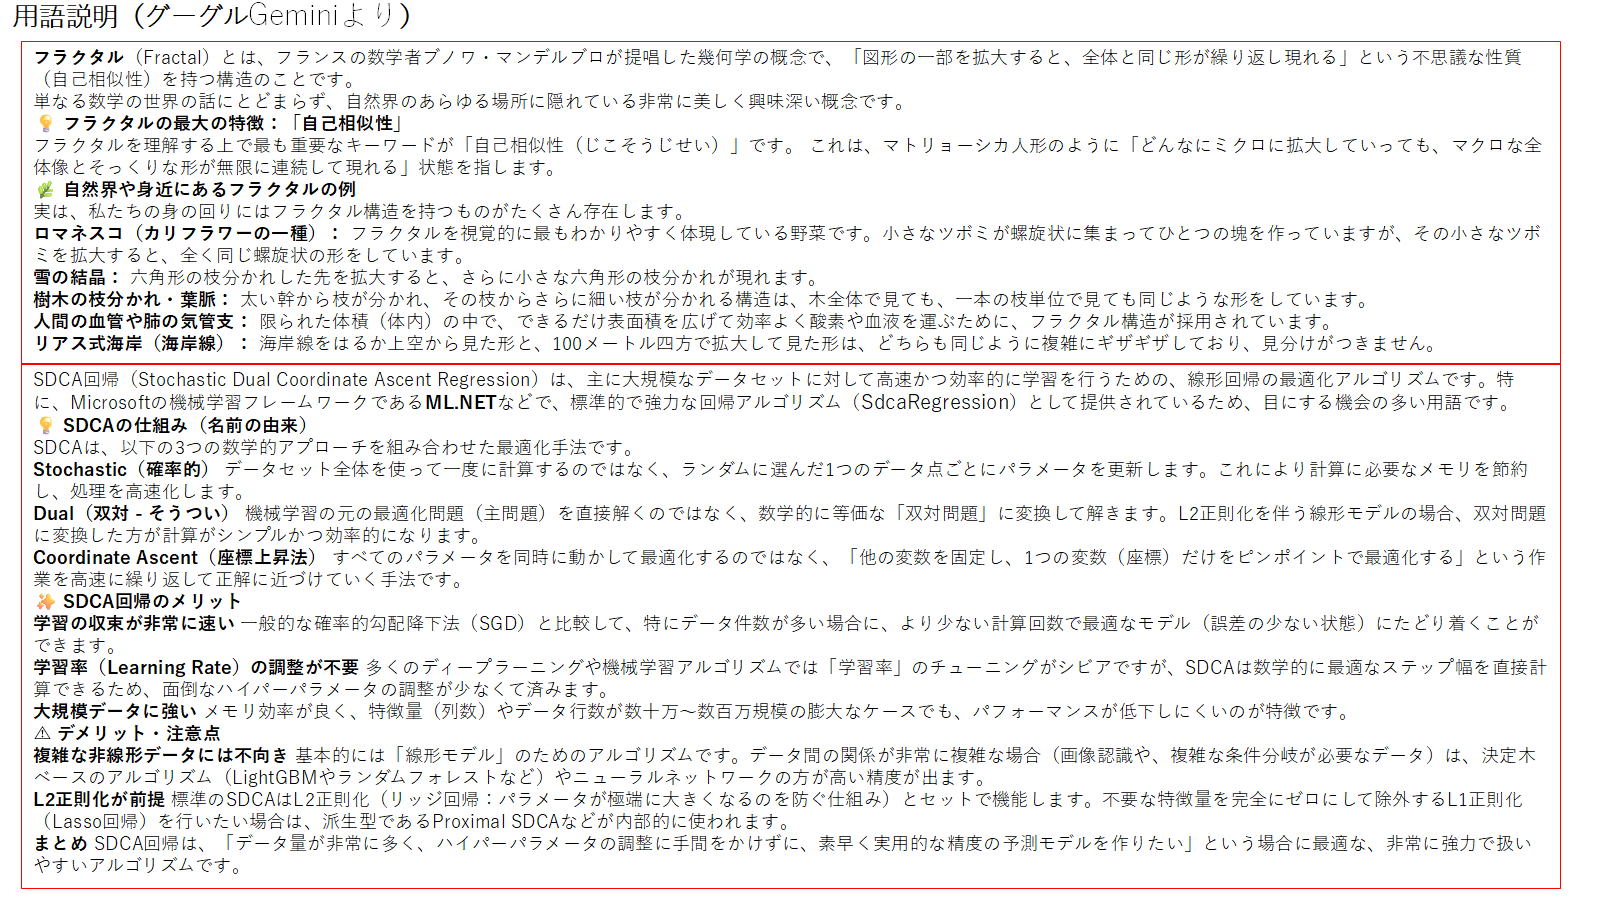
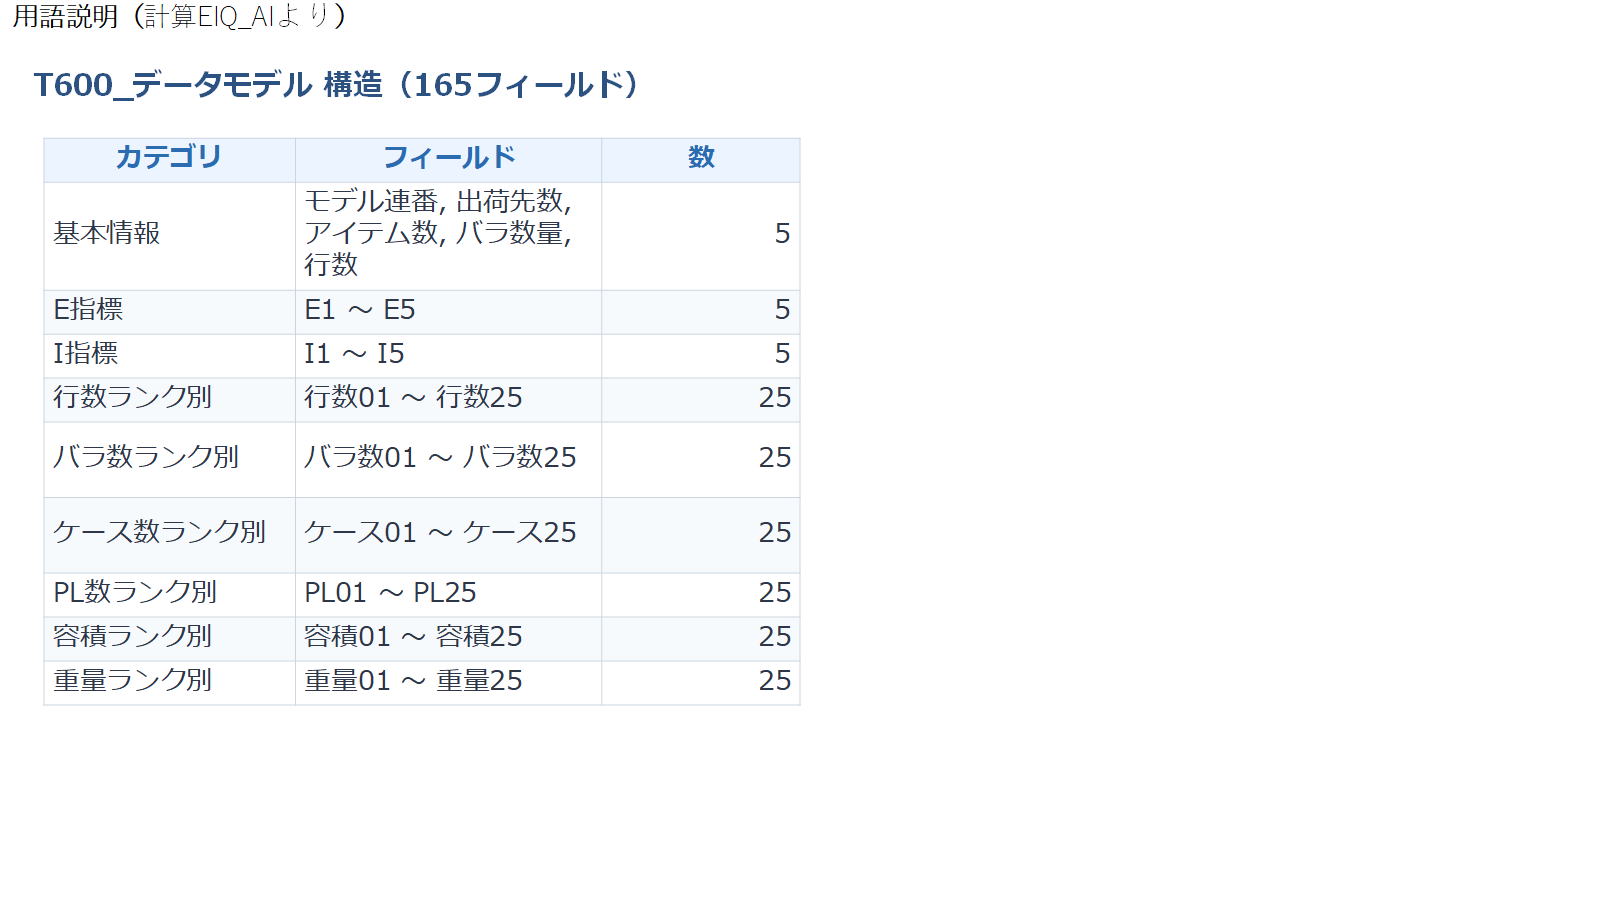
EIQ Analysis (Entry/Order, Item, Quantity) evaluates distribution center characteristics across three key dimensions: Order Count (E), Item Variety (I), and Shipped Volume (Q).
Serves as the decision framework for selecting order fulfillment workflows—determining whether to deploy single-order picking vs. batch picking with consolidation sorting.
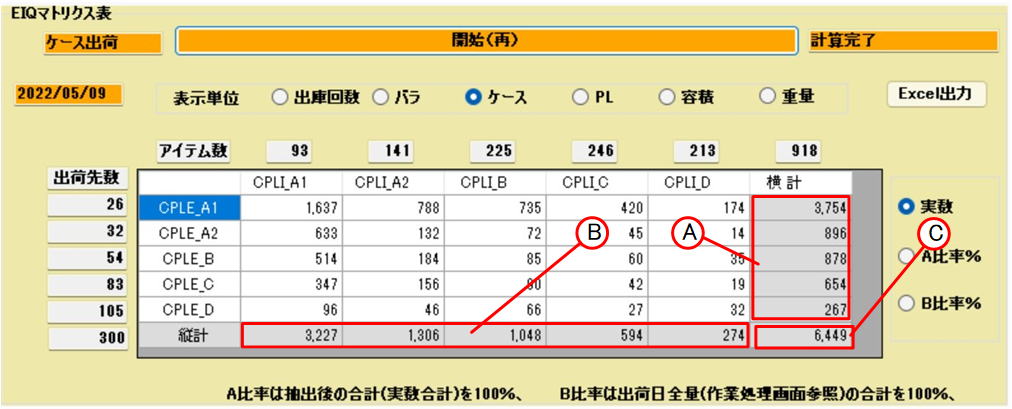
By plotting items by volume on the vertical axis and shipping destinations by order line count on the horizontal axis, EIQ matrices guide optimal material handling equipment selection based on distribution density.
EIQ Matrix Tabulation Output (Tera Calculation 1)
2-2. Order Profile Understanding & Delivery Efficiency
The degree to which planners understand order profiles determines achievable delivery lead time reductions[cite: 12]. Quantifying hourly shipping concentration spikes eliminates truck dock congestion and ensures smooth outbound dispatch[cite: 12].
2-3. Three Core EIQ Elements & Advanced Application
1) Core EIQ Components
Developed by logistics consultant Shin Suzuki, the EIQ framework evaluates three fundamental factors:
- E (Entry / Order): Order line count (number of purchase orders/destinations). Indicates customer granularity and order fragmentation.
- I (Item): SKU variety count (number of managed line items). Directly impacts required storage locations and pick faces.
- Q (Quantity): Volume count (total shipped pieces/cases). Establishes conveyor throughput capacity and truck dispatch counts.
* Incorporating S (Size / Shape) to execute "SEIQ Analysis" enables precise storage rack and handling equipment specification.
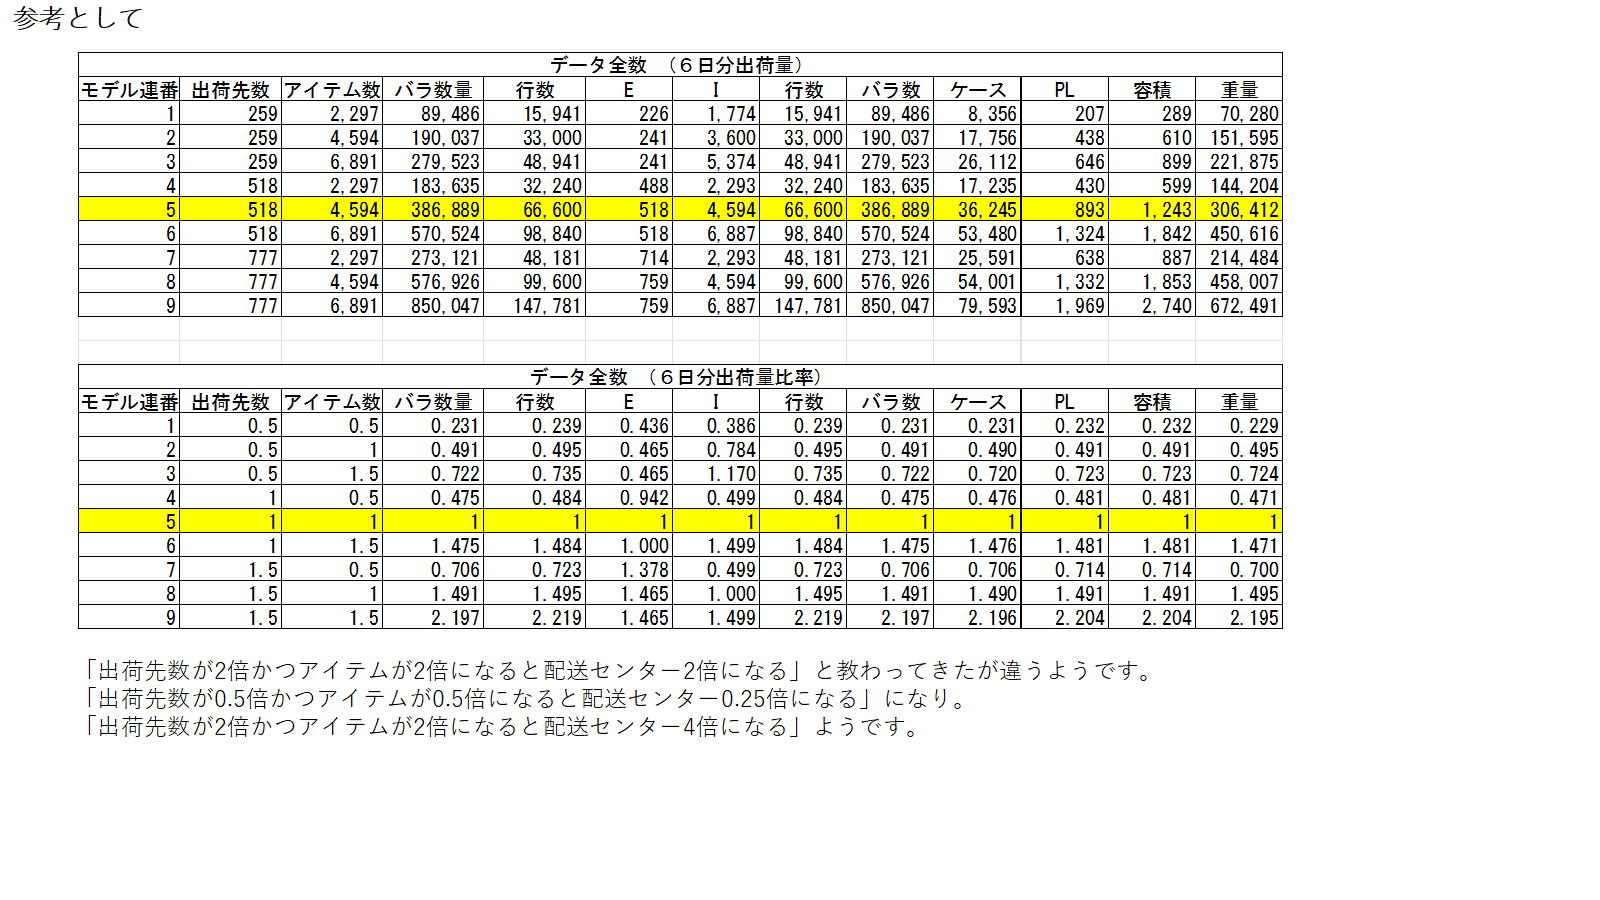
2) EIQ Scatter Plot Visualization
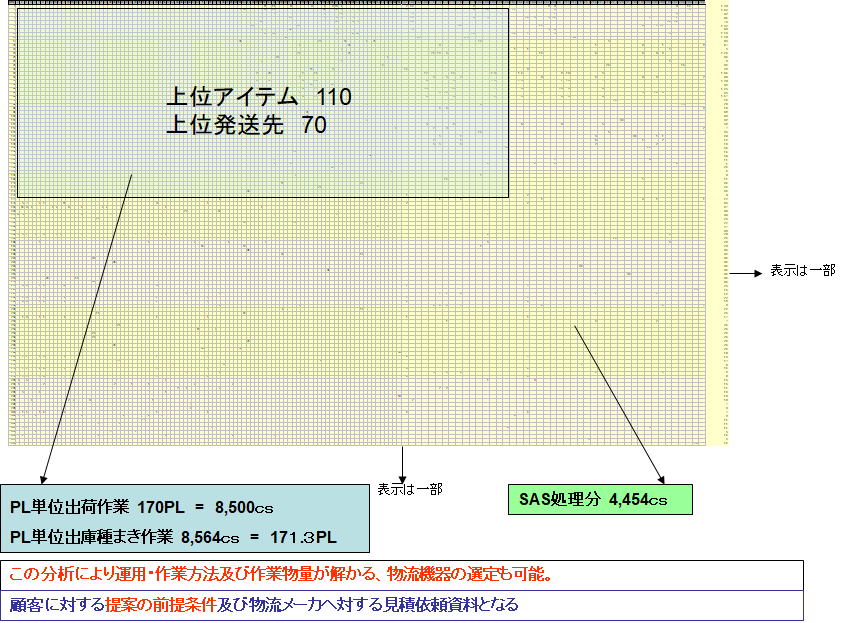
Scatter plots visually display distribution patterns across datasets. Identifying bulk order concentrations vs. small-lot piece-picking volume spikes enables optimized shift scheduling and labor allocation.
2-4. EIQ Scatter Plot Practical Application
2-5. Current State Survey Checklist for Logistics Planning
Successful logistics facility planning requires pairing quantitative analytics with comprehensive qualitative surveys covering location conditions and labor location availability:
📦 Inventory & Storage Profiles
- Master SKU registration count
- Active SKU count (regularly moving stock)
- Average / Peak inventory levels (cases/pieces)
- Storage unit loads (pallets, cases, loose pieces)
- Seasonal volume fluctuations (peak footprint requirements)
🚚 Shipping & Site Location Conditions
- Shipping unit loads (pallets, cases, loose pieces)
- Daily destination counts and geographic distribution
- Target customer arrival lead times (same-day/next-day)[cite: 12]
- Truck fleet mix (heavy 10t vs. medium 4t) and vehicle counts
- Traffic location conditions (highway IC and arterial route access)
👥 Operational Workflows & Labor Location
- Operating shifts (early morning / night shift requirements)
- Required headcount (total daily operator hours)
- Local population density & public transit (labor location recruitment ease)
- Local hourly wage benchmarks (regional labor cost standards)
💻 Systems & Operational Integration
- Order cut-off times and dispatch release schedules
- WMS deployment and location management capabilities
- Inspection methods (RF terminals, vision systems)
- Real-time parcel tracking and traceability capabilities