3-2. Logistics Facility Planning & Logistics Park Selection via Freight Transport Data
Building a competitive supply chain and executing optimal logistics facility planning requires an accurate grasp of macro freight transport trends and regional cargo flows (intra-regional flow vs. inter-regional flow).
Selecting site locations based purely on "closest proximity to demand" or "lowest land rent" often leads to operational failures—such as surging freight transport expenses, severe dock congestion, and driver recruitment bottlenecks under labor regulations.
This article analyzes 20-year domestic freight transport volume trends, intra-regional vs. inter-regional flow balances across regional blocks, and the hub functions of major national logistics parks to establish practical facility planning guidelines.
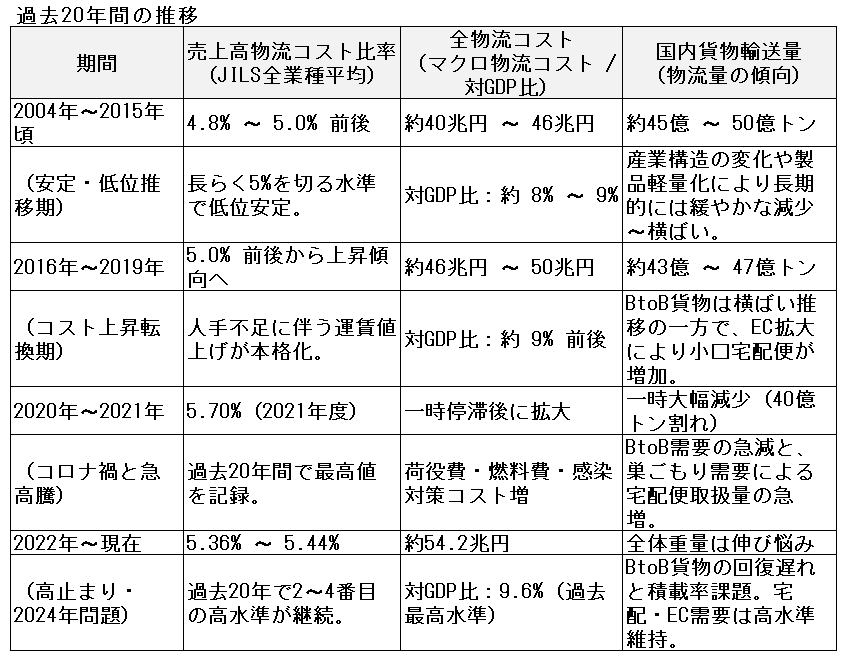
1. 20-Year Freight Transport Trends & Background
The first step in effective logistics facility planning is understanding macro environmental shifts surrounding nationwide freight transport.
1-1. Total Logistics Cost Trends (Logistics Cost-to-Sales Ratio)
Low / Stable Period (2000s – Mid-2010s)
Intense carrier price competition and corporate efficiency efforts kept logistics costs low, averaging under 5% to ~5% of sales revenue.
Long-Term Upward Trend (Post-2016)
Driver shortages, rising fuel prices, and labor wage hikes accelerated total freight transport cost increases across all industries.
Sustained High-Cost Plateau (2021 – Present)
Reached a 20-year peak of 5.70% in FY2021 and remains elevated at 5.36%–5.44%, driven by labor compliance and general inflation.
1-2. Structural Shifts in Cargo Volume (Tonnage vs. Piece Count)
Gradual Decline in Total Tonnage
Offshoring of manufacturing, product lightweighting, and shared logistics reduced total domestic freight transport tonnage from 5.0 billion tons in the early 2000s to the low 4.0 billion ton range.
B2B Bulk vs. B2C E-Commerce Divergence
While B2B bulk movement stagnates, E-commerce growth caused parcel delivery volumes to explode. Order fragmentation increases operational handling load and shipping frequency despite lower total tonnage.
2. Regional Cargo Flow Structure Across 10 National Blocks
Determining hub locations in logistics facility planning relies heavily on analyzing shipment origins: intra-regional flow (completed within the block) vs. inter-regional flow (cross-block shipping).
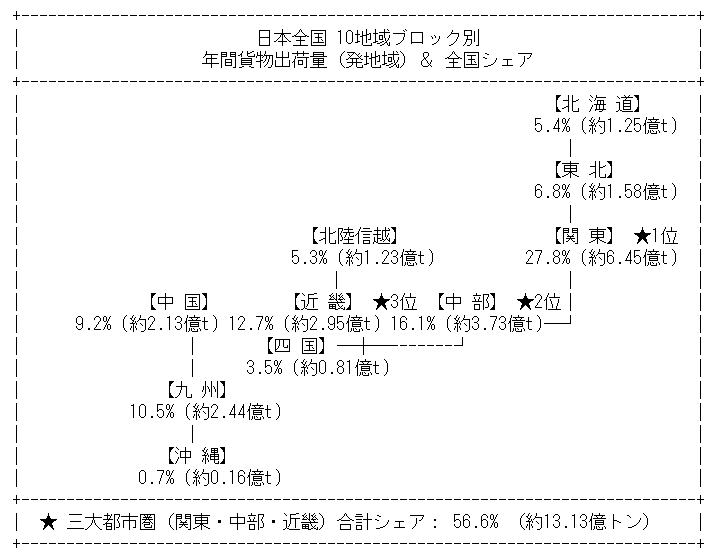
Intra-Regional Flow Represents 70%–80% of Volume
The vast majority (~70%–80%) of freight transport originating from any regional block stays within that same block (intra-regional flow). Local delivery network design forms the foundation of site planning.
Inter-Regional Flow Targets Adjacent Blocks & Metros
The remaining 20%–30% (inter-regional flow) consists primarily of shipments to adjacent blocks or concentrated linehaul shipping to major metropolitan centers (Kanto, Chubu, Kansai).
Mapping Data Insights for Facility Planning
1. Heavy Concentration in Metropolitan Areas (56.6%)
Three blocks—Kanto (27.8%), Chubu (16.1%), and Kansai (12.7%)—account for over half (56.6%) of all domestic freight transport. Establishing regional master hubs requires selecting premier logistics parks with highway access to these metro areas.2. High Intra-Regional Completion Rates (National Average: 77.1%)
Nationwide, 77.1% of freight transport is completed within its origin block (intra-regional flow); cross-block shipping (inter-regional flow) accounts for only 22.9%. Kanto and Kyushu exhibit exceptionally high intra-regional ratios, making local last-mile networks vital for logistics facility planning.3. Aichi Prefecture Ranks #1 Nationally
While Kanto leads among regional blocks, Aichi Prefecture ranks #1 among individual prefectures in total freight transport volume due to its dense manufacturing base, highlighting Chubu's role as a major production-distribution nexus.
3. Major National Logistics Parks & Hub Concentrations
Japan's major logistics parks (Distribution Business Complexes) are strategically developed adjacent to highway interchanges (ICs), arterial routes, sea ports, and air cargo terminals to alleviate urban congestion and centralize freight transport.
1. Greater Tokyo Area (Kanto Region)
Serving vast consumer markets and international gateways, Kanto's logistics parks along coastal ports and ring expressways (Gaikan / Ken-O) handle critical intra-regional and inter-regional flows.
-
Keihin / Heiwajima Complex (Ota-ku, Tokyo)
Houses Japan's largest truck terminal (Keihin Truck Terminal). Adjacent to Haneda Airport and Port of Tokyo, connected directly to the Bayshore / Haneda Expressways.
-
Itabashi Distribution Complex (Itabashi-ku, Tokyo)
Located along Metropolitan Expressway Route 5, offering access to Kan-Etsu and Tohoku Expressways. Key relay hub for northern Kanto intra-regional flow and northern inter-regional flow.
-
Kasai Distribution Complex (Edogawa-ku, Tokyo)
Serves central Tokyo, Chiba, and Ibaraki. Integrates Kasai Truck Terminal and extensive cold-chain cold storage facilities.
-
Atsugi Logistics Complex / Inland Area (Atsugi / Aikawa, Kanagawa)
Major junction connecting Tomei (Atsugi IC), Shin-Tomei, and Ken-O Expressways. Acts as a master hub for Kanto intra-regional flow and Tokai/Kansai inter-regional flow.
2. Chubu Region (Nagoya Area)
A major industrial hub connecting Tomei, Meishin, Chuo, and Shin-Tomei expressways.
-
Komaki Distribution Complex (Komaki, Aichi)
Located at the Komaki IC junction connecting Tomei and Meishin expressways. Functions as Japan's premier cross-dock hub for eastern and western inter-regional flow.
-
Meiko / Tobishima Complex (Tobishima / Nagoya, Aichi)
Directly connected to Port of Nagoya container terminals and Isewangan Expressway. Handles import/export processing, automotive components, and maritime freight transport.
3. Kansai Region (Osaka / Hyogo Area)
Interconnected by Meishin, Chugoku, Hanshin, Kinki, and Shin-Meishin expressways, serving western Japan inter-regional flows.
-
Northern Osaka Distribution Complex (Ibaraki / Minoh, Osaka)
Kansai's largest logistics hub, connecting Ibaraki IC (Meishin), Chugoku, Kinki, and Shin-Meishin expressways. Handles Keihanshin intra-regional flow and western Japan distribution.
-
Higashi-Osaka Distribution Complex (Higashi-Osaka, Osaka)
Connected to Kinki Expressway and Hanshin Expressway Route 13. Serves manufacturing clusters and urban city-center deliveries in Osaka.
-
Kobe Distribution Complex (Kobe, Hyogo)
Connects Port of Kobe, Sanyo, Chugoku, and Kobe-Awaji-Naruto expressways. Key gateway for Chugoku, Shikoku, and international trade.
4. Kyushu, Chugoku, Shikoku, Hokkaido & Tohoku Regions
Regional blocks rely on master logistics parks established at key highway junctions and major metro perimeters.
-
Tosu Distribution Complex (Tosu, Saga)
Located at the "Kyushu Logistics Crossroads" connecting Kyushu, Nagasaki, and Oita expressways, allowing same-day delivery across all Kyushu prefectures.
-
Fukuoka Distribution Center / Tanotsu (Fukuoka, Fukuoka)
Kyushu's largest wholesale and logistics park, situated near Fukuoka IC, Port of Hakata, and Fukuoka Airport for urban intra-regional flow.
-
Sapporo Distribution Center / Oyachi (Sapporo, Hokkaido)
Connected to Do-O Expressway (Sapporo-Minami IC). Handles statewide Hokkaido freight transport and urban Sapporo deliveries.
-
Sendai Distribution Center (Sendai, Miyagi)
Near Tohoku Expressway, Sendai-Tobu Road, and Port of Sendai. Functions as the master hub serving all 6 Tohoku prefectures.
4. Three Core Roles of Logistics Parks in Facility Planning
When executing advanced logistics facility planning, establishing operations within planned logistics parks (Distribution Business Complexes) rather than isolated isolated sites offers major strategic advantages. Logistics parks function as vital social infrastructure connecting local economies with national freight transport networks through three key roles:
-
Drastic Cross-Docking & Handling Efficiency at Transportation Nodes
Logistics parks are positioned at prime transport nodes near expressway ICs, ports, and rail terminals. They act as high-efficiency cross-dock hubs receiving long-haul, high-volume inter-regional flow and transferring cargo to short-haul urban intra-regional flow. Separating long-haul heavy trucks from urban delivery vans at nodes eliminates empty running, reduces driver detention times, and minimizes overall transport costs.
-
Urban Environmental Protection & 24/7 Unrestricted Operations
To protect residential areas from truck idling, noise, and emissions, logistics parks are isolated in suburban or port industrial zones under urban zoning laws. Preventing community complaints allows logistics operators to maintain 24/7/365 continuous operations, including late-night and early-morning truck dock arrivals, with complete regulatory stability.
-
Consolidated Shipping & Aggromeration Synergies (Driving Green Logistics / GX)
Concentrating truck terminals, public warehouses, automated high-bays, and distribution centers within a single logistics park enables joint truck dispatch and collaborative shipping among neighboring shippers. Improving vehicle load factors solves driver shortage constraints while significantly reducing carbon emissions, serving as a core foundation for Green Transformation (GX) in logistics.