3-14. Master Project Planning & Proposal Document Samples
1. Current Operational Challenges & Core System Philosophy

【Diagram Analysis】 Outlines current operational bottlenecks (labor load imbalances, low cubic storage efficiency, manual dependencies) and defines foundational concepts for new system implementation[cite: 29].
2-1. Master Logistic Conditions (Part 1)
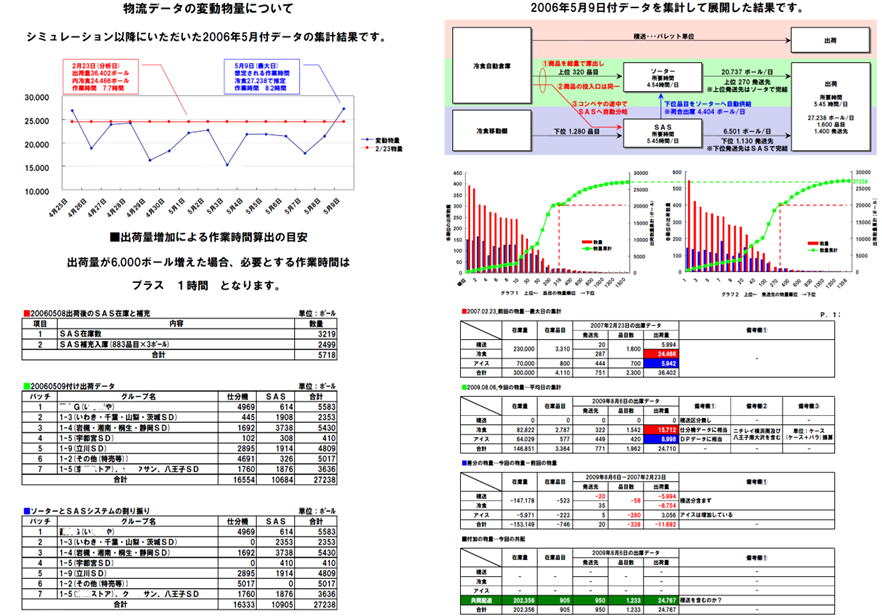
【Diagram Analysis】 Analyzes historical shipping volume fluctuations, forecasts future cargo growth, and establishes automated equipment allocation criteria[cite: 29].
- Shipping Volume Fluctuation Analytics: Visualizes daily shipment throughput[cite: 29]. Evaluates peak-day volumes to establish quantitative labor hours (e.g., "+6,000 cases requires +1 hour labor")[cite: 29].
- Equipment Allocation (Sorter vs. SAS):[cite: 29]
- High-velocity SKUs route to cold-storage automated warehouses and high-speed sorters[cite: 29].
- Slow-moving SKUs route to mobile racking and automated sorting systems (SAS) to optimize storage density and sorting accuracy[cite: 29].
- Batch & Zone Sorting Verification: Aggregates and validates item throughput per delivery group across automated sorters[cite: 29].
2-2. Master Logistic Conditions (Part 2)
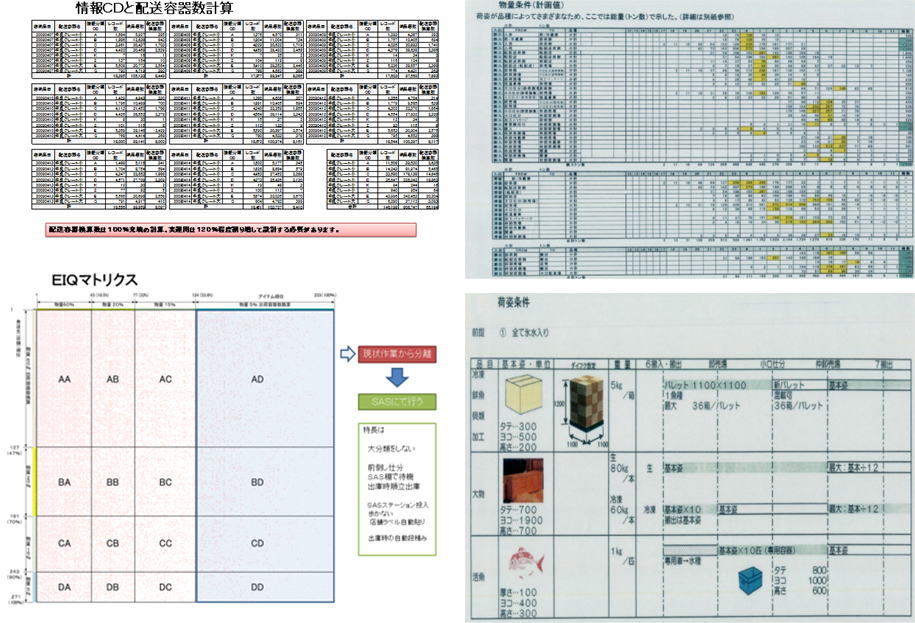
【Diagram Analysis】 Displays order calculation results, packaging specifications (carton dimensions, weights, pallet configurations), and EIQ matrices[cite: 29].
- Container Requirements: Calculates required tote quantities at 100% capacity and 120% buffer allowance[cite: 29].
- EIQ Categorization: Categorizes order profiles (high-variety small-lot vs. low-variety bulk) to establish operational rules between automated AS/RS and manual picking[cite: 29].
- Packaging Constraints: Defines temperature-zone dimensions, weights, and container shapes (cartons, barrels, tanks)[cite: 29].
3. Master Material Flow Diagram
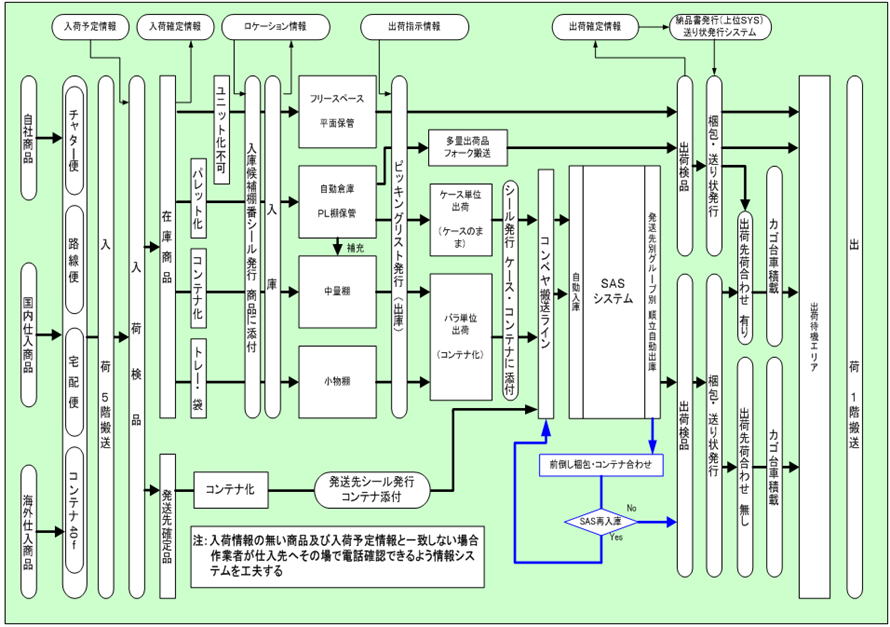
【Diagram Analysis】 Systematizes end-to-end operational workflows from inbound receiving (chartered trucks, LTL, sea containers) to outbound staging[cite: 29].
- Receiving & Putaway: After inspection, goods are palletized/toted, tagged with barcode putaway labels, and routed to AS/RS, shelving, or floor storage[cite: 29].
- Retrieval & Picking: Picking lists direct bulk items to forklift transport, case items to conveyors, and piece items to automated sorters (SAS)[cite: 29].
- SAS Re-entry & Order Consolidation: Sorters route items for order consolidation[cite: 29]. Incomplete orders re-enter SAS for staged wave consolidation[cite: 29].
- Inspection & Shipping: Orders undergo outbound scanning, auto-labeling, roll-cage loading, and dispatch from ground-floor dock berths[cite: 29].
4. Footprint Allocation & CAD Layout Design
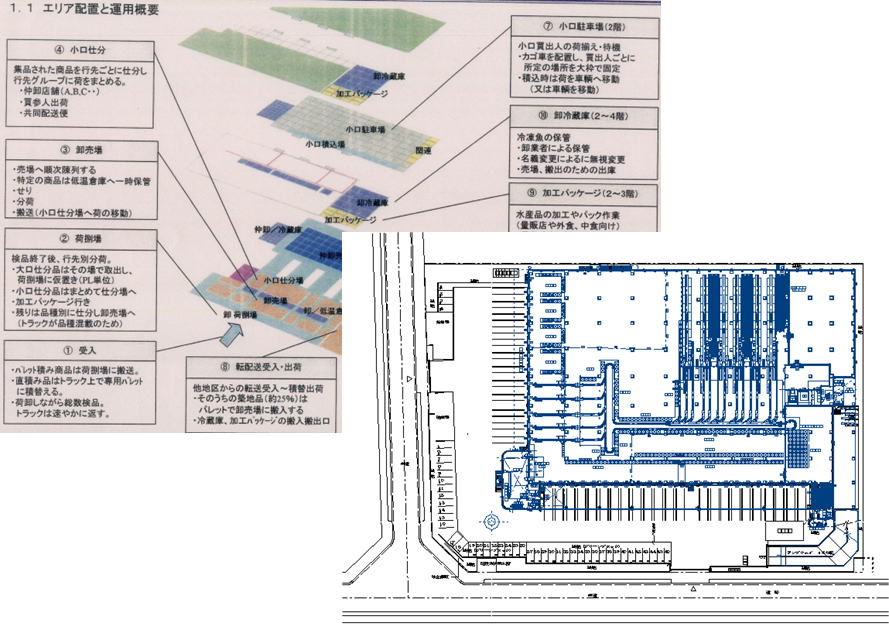
【Diagram Analysis】 CAD layout plan for a multi-functional distribution center handling seafood, cold storage, and small-lot sorting[cite: 29].
- Functional Zone Allocation: Segregates receiving docks, sorting areas, auction halls, small-lot consolidation, 2F staging areas, multi-story cold storage (2F–4F), and processing/packaging zones[cite: 29].
- CAD Architectural Layout: Optimizes dock berth counts, truck turning radiuses, equipment footprints, and aisle widths down to the millimeter[cite: 29].
5. Storage & Conveyance Option Evaluation
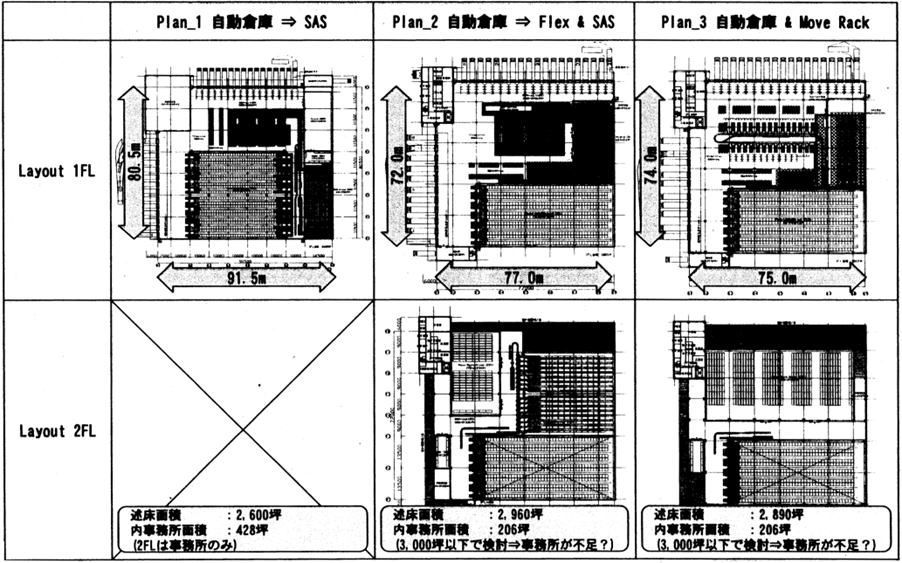
【Diagram Analysis】 Evaluates three architectural layout options (Plans 1–3) across dimensions, floor areas, and office footprints[cite: 29].
- Plan 1 (AS/RS ➔ SAS): 1F Footprint 80.5m × 91.5m (2,600 Tsubo total area). Highly equipment-consolidated layout[cite: 29].
- Plan 2 (AS/RS ➔ Flex & SAS): 1F Footprint 72.0m × 77.0m (2,960 Tsubo total area), featuring flexible 2F storage[cite: 29].
- Plan 3 (AS/RS & Mobile Racks): 1F Footprint 74.0m × 75.0m (2,890 Tsubo total area), incorporating mobile racks to boost storage density[cite: 29].
6. IT System Architecture & Operational Schedules
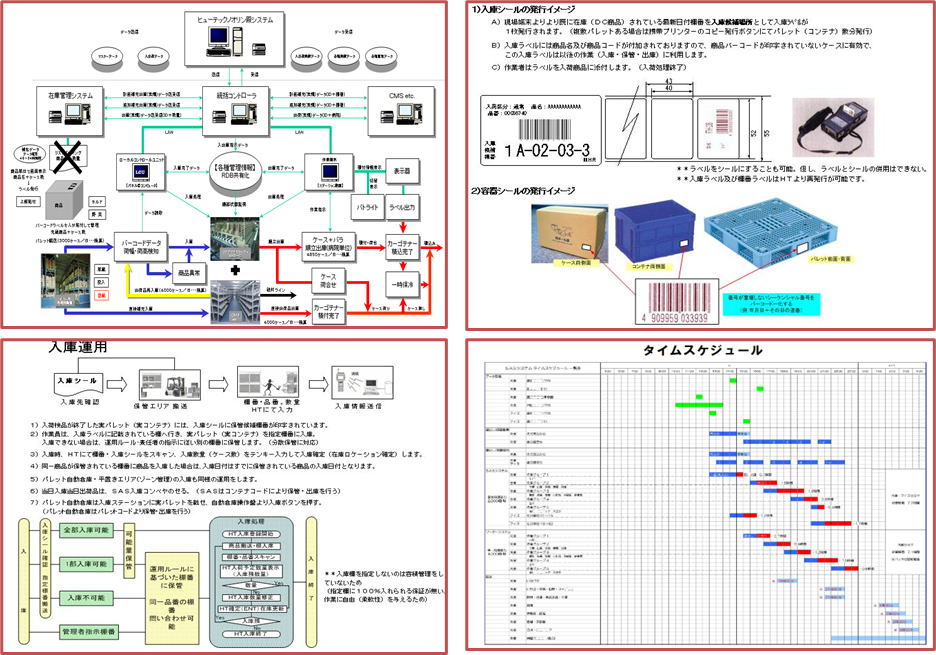
【Diagram Analysis】 Details IT system topology (WMS, WCS Controllers, RF Terminals) and hourly operational work schedules[cite: 29].
- System Topology: Connects host ERP, WMS, WCS, Pick-to-Light controllers, barcode scanners, and label printers in real time via LAN[cite: 29].
- Barcode Labeling Workflow: Generates 1) Inbound Barcode Seals and 2) Sequential LPN Container Seals for totes and pallets[cite: 29].
- RF Terminal Inbound Workflow: Operators scan location/SKU/quantity via handhelds to confirm putaway rules for AS/RS or floor storage[cite: 29].
- Hourly Operational Schedule: Tracks labor staffing and task completion curves across receiving, putaway, picking, sorting, and shipping[cite: 29].
7. Key Improvement Points & Target Benefits
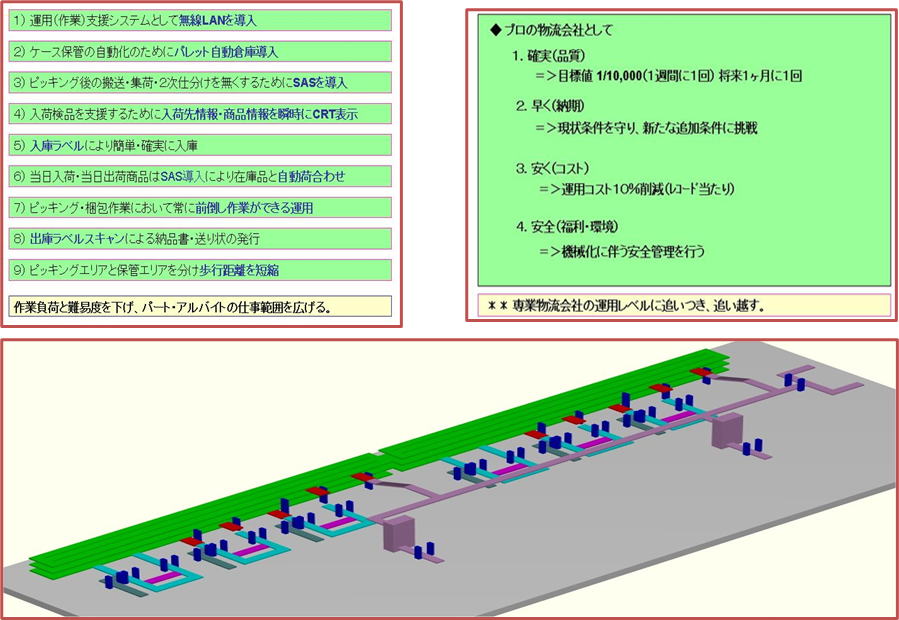
【Diagram Analysis】 Outlines specific improvement initiatives, 3D conveyor line renderings, and quantitative KPI targets[cite: 29].
- Core Initiatives: Wireless LAN setup, Pallet AS/RS deployment, elimination of secondary manual sorting via SAS, real-time CRT dock displays, and walk-distance reduction[cite: 29].
- Four Target Logistics KPIs:[cite: 29]
- Quality (Accuracy): Target error rate ≤ 1 in 10,000 orders[cite: 29].
- Speed (Lead Time): Compliance with current delivery windows while handling rush orders[cite: 29].
- Cost (OPEX): 10% reduction in operational handling cost per order line[cite: 29].
- Safety (Environment): Zero-accident safety standards through automated equipment segregation[cite: 29].
- 3D Conveyor Network: 3D model illustrating multi-story overhead conveyors integrated with automated sorters[cite: 29].
8. Financial Investment & Depreciation Schedule
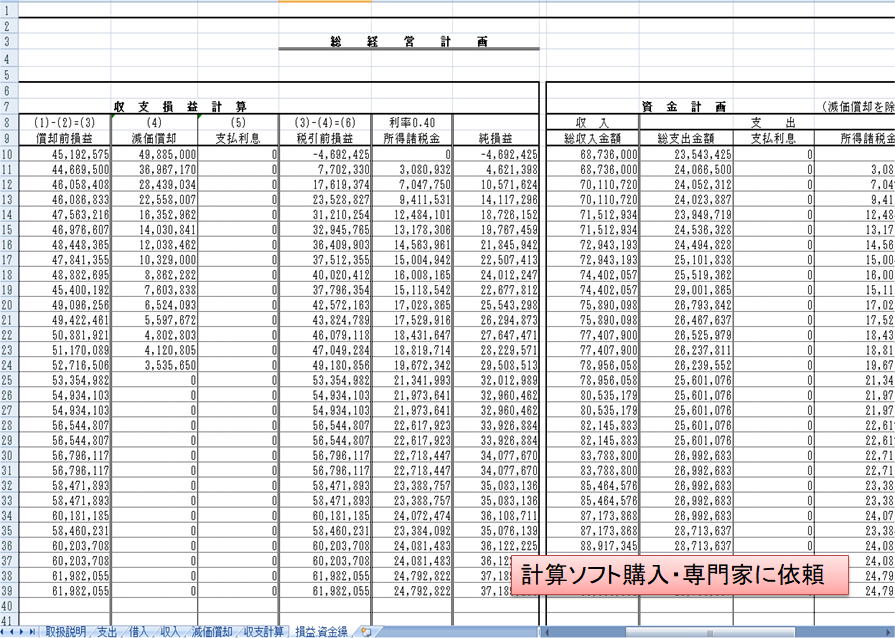
【Diagram Analysis】 Long-term 30-year financial P/L projection and cash flow master plan[cite: 29].
- P/L Income Projection (EBITDA, Depreciation, Pre-Tax Profit, Net Income):[cite: 29]
- Initial Year 1 depreciation (~49.88M JPY) creates a temporary pre-tax loss (-4.69M JPY) against Year 1 EBITDA (45.19M JPY)[cite: 29]. However, Year 2 achieves rapid profitability (Pre-tax profit +7.7M JPY / Net profit +4.62M JPY)[cite: 29].
- Annual depreciation declines over time (Year 1: ~49.88M JPY ➔ Year 15: ~10.32M JPY ➔ Year 16+: 0 JPY), reflecting capital recovery[cite: 29].
- Cash Flow Plan (Gross Receipts vs. Expenses):[cite: 29]
- Manages annual cash receipts (~68.73M–88.91M JPY) against cash outflows (~23.54M–28.71M JPY) to guarantee steady positive cash reserves[cite: 29].
- * Financial models require specialized accounting software or advisor verification, factoring in corporate tax rates (0.40) and debt interest rates[cite: 29].