2-5. Return on Investment (ROI) Calculation Methods
Calculating Return on Investment (ROI) for distribution center mechanization and automation begins by accurately defining "Initial & Operating Costs" and "Reducible or Generated Economic Value."
1. Identifying Cost and Benefit Elements
First, list all expenditure items (Costs) and financial gains (Benefits) without omission.
• Initial Capital Expenditure (CAPEX)
- Equipment purchase costs for material handling and robotics
- Warehouse Management System (WMS) additions, ERP integration, and Warehouse Control System (WCS) fees
- Installation, electrical, and network infrastructure setup
- Implementation consulting and project labor expenses
• Operating Expenses (OPEX: Annual)
- Maintenance contracts (Typically ~5% to 10% of base equipment cost annually)
- Software licensing and cloud subscription fees
- Incremental electrical power consumption
- Replacement parts and consumable contingency funds
• Direct Cost Savings (Quantitative)
- Labor Cost Reduction: (Headcount Reduced × Average Salary) or (Hours Reduced × Hourly Rate)
- Overtime Reduction: Decreased overtime hours due to faster throughput speeds
- Mis-shipment Error Reduction: Lower reshipping freight, re-inspection labor, and inventory waste costs
• Indirect Benefits (Quantitative / Semi-Quantitative)
- Footprint Optimization & Rent Savings: Reduced floor area via high-density vertical AS/RS storage
- Capacity Expansion Revenue Gains: Prevented opportunity losses by handling peak volume spikes
• Qualitative Benefits (Strategic Factors)
- Resilience against labor recruitment shortages, improved ergonomics (reducing heavy labor), and standardized picking quality
2. Key Financial Evaluation Metrics
Corporate capital allocation decisions typically rely on three core metrics:
A. Payback Period Method
Calculates the number of years required to recover the initial capital investment. Most intuitive and widely used in practical logistics management.

- Benchmark: For material handling and robotics investments, a payback period of 3 to 5 years or less represents the standard hurdle rate.
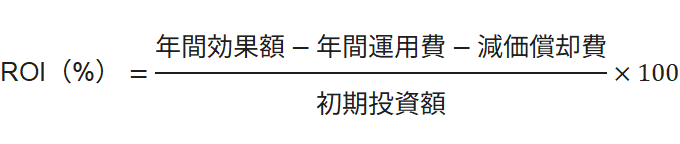
B. Return on Investment (ROI)
Measures profitability relative to the capital invested as a percentage (%).
C. Net Present Value (NPV)
Evaluates major capital investments over 5 to 10-year horizons by discounting future cash flows back to present value using a discount rate (e.g., WACC). An NPV > 0 indicates investment viability.
3. Step-by-Step Calculation Example
- Deployed Equipment: 10 Autonomous Mobile Robots (AMRs) for picking assistance
- Initial Investment (CAPEX): 30 Million JPY (Robots + System Integration + Setup)
- Annual OPEX: 3 Million JPY / Year (Maintenance + Cloud Software Licenses)
- Operating Hours: 8 Hours / Day, 250 Days / Year
- Pre-Automation Baseline: 10 Picking Operators (1,400 JPY/hr, Total Annual Labor ~28M JPY)
- Post-Automation Result: Productivity gains eliminate 4 FTEs (~40% labor reduction)
- Labor Cost Reduction: 4 FTEs × 2.8M JPY Annual Salary = 11.2 Million JPY / Year
- Error & Overtime Reduction: 0.8 Million JPY / Year
- Gross Annual Benefits = 12.0 Million JPY / Year
- Net Annual Benefit = Gross Benefits (12.0M JPY) − OPEX (3.0M JPY) = 9.0 Million JPY / Year
- Payback Period = 30.0 Million JPY CAPEX ÷ 9.0 Million JPY Net Benefit = Approx. 3.3 Years
With a payback period of approximately 3.3 years, the project meets standard hurdle rates (under 5 years), qualifying as "Financially & Operationally Viable."
4. Common ROI Calculation Pitfalls
1. Averaging Peak vs. Off-Peak Volumes
Calculating ROI purely on annual average volumes risks idle equipment during off-peak seasons, resulting in missed recovery targets. Always model monthly and daily volume fluctuations.
2. Escalating Long-Term Maintenance Costs
Post-warranty overhaul and battery replacement costs rise after Year 5. Multi-year simulations must account for increased maintenance budgets in Years 6–7.
3. Ignoring Initial Learning Curves (Go-Live Lag)
Do not assume 100% operational efficiency from Month 1. Conservative models discount initial benefits (modeling 50%–70% capacity) during the 3 to 6-month ramp-up phase.