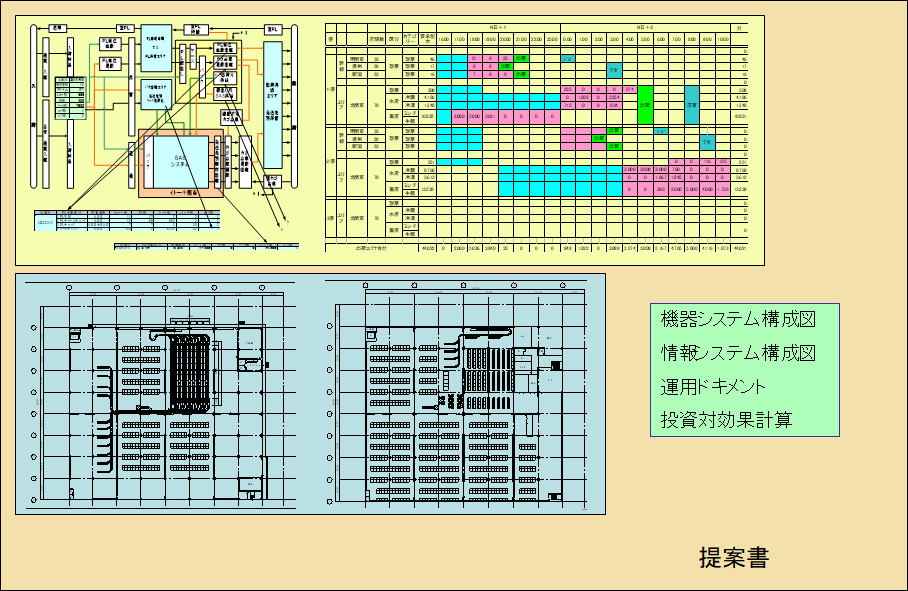
1. Background of Data Analysis
3-4. Relationship with Facility Layout Drawings
A Facility Layout Drawing (Floor Plan) is a 2D or 3D architectural plan that optimally places storage equipment (racks, AS/RS), work areas (inspection, packing, sorting), material handling equipment (conveyors, sorters), aisles, and buffer staging areas within the building envelope.
Drafting layouts based solely on intuition or experience risks critical failures such as insufficient rack capacities, bottlenecked staging areas, or hazardous forklift aisle intersections. Creating superior facility layouts requires quantitative evidence derived from EIQ data analysis.
2) Engineering Process: From EIQ Analysis to Final Layout Drawings
Rather than drawing CAD plans directly from raw figures, Tera Calculation follows a rigorous, logical progression: [EIQ Analysis] ──> [25-Block EIQ Matrix] ──> [Equipment Mapping] ──> [Material Flow Diagram] ──> [Final Facility Layout Drawing].
Step 1: EIQ Analysis & 25-Block EIQ Matrix Generation
Execute EIQ analysis on the target-day dataset to generate a 25-block matrix (5 Item Tiers × 5 Destination Tiers). Full-case and loose-piece shipments are segregated to evaluate volume velocity concentrations from fast-movers to slow-movers.
Step 2: Equipment Mapping onto the EIQ Matrix
Map specific storage and handling equipment to each block based on item velocity tiers. For example, high-velocity Tier A1 is mapped to Pallet AS/RS or case sorters, medium-velocity Tier B to pallet racking or flow racks, and low-velocity Tier D to static shelving. This directly calculates required storage capacities (pallets, shelf levels) and process throughputs (cases/hr, pick lines/hr) for each system.
Step 3: Mapping Quantified Volumes into Material Flow Diagrams
Structure the throughput volumes passing through mapped equipment lines (Receiving ──> Storage ──> Replenishment ──> Picking ──> Packing ──> Shipping) into a "Material Flow Diagram with Quantified Figures." Visualizing process-to-process volume movements clarifies zone proximity requirements and flow directions within the building.
Step 4: Footprint Calculation & Final Layout CAD Drafting
Calculate required floor space (sq ft / m²) for each zone by factoring equipment dimensions, fleet counts, aisle widths (3.0–3.5m for forklifts, 1.2–1.5m for personnel), and staging buffer allowances onto the throughput volumes. Fitting these footprint metrics onto the building column grid completes the final CAD floor plan layout.
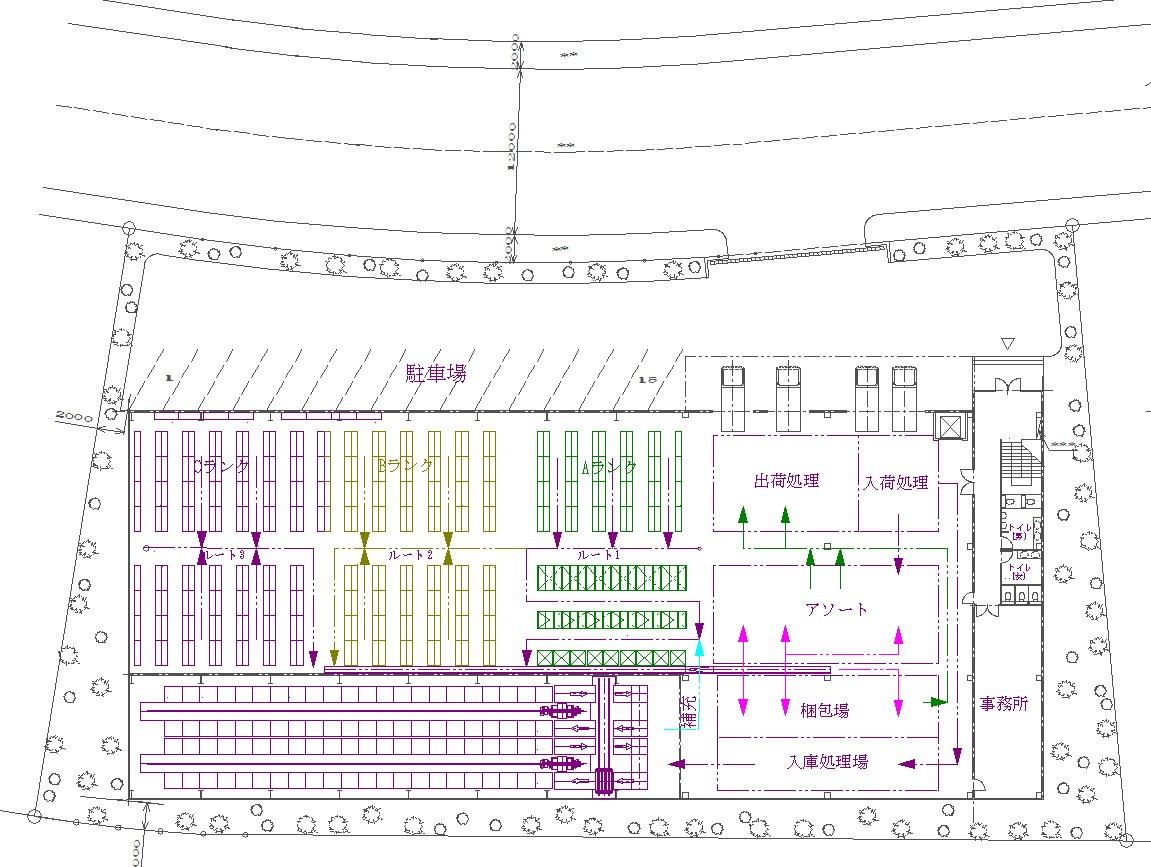
3) Equipment Options & Layout Variants: Evaluating 3–4 Proposal Alternatives for Optimal ROI
In logistics system engineering, **relying on a single layout option is extremely risky**. By creating and simulating **3 to 4 distinct proposal alternatives** with varied equipment selections and spatial flows, engineers can identify the best-fit solution that delivers maximum Return on Investment (ROI).
[Why Is It Essential to Compare 3 to 4 Proposal Alternatives?]
- Option A (Low-CAPEX / Manual & Static Racking Plan): Minimizes initial capital expenditure (CAPEX) but visualizes risks of sustained high ongoing labor costs (OPEX) and human error rates.
- Option B (Balanced Plan / Standard Automation): Applies flow racks or Digital Picking Systems (DPS) strictly to fast-moving SKUs while using static racks for slow-movers—offering a highly balanced ROI.
- Option C (High-Automation / Future-Proof Plan): Deploys full automation including Pallet AS/RS, Autonomous Mobile Robots (AMRs), and case sorters. Requires higher initial CAPEX but maximizes labor savings and processing speed.
- Option D (Footprint-Optimized Layout Plan): Reconfigures dock bay positions and conveyor loop lines to minimize travel paths by maximizing building column-grid utilization.
[Quantitative ROI & Payback Period Evaluation]
Using throughput and labor requirements calculated in Tera Calculation, engineers perform quantitative comparisons between initial CAPEX and operational OPEX for each option.
Rather than simply recommending "the latest automation technology," proving whether **"the payback period falls within 5 to 7 years"** and **"the layout easily accommodates future business expansion"** provides clients and executive boards with an undeniable, fact-based engineering proposal.