Section 1 EIQ Analysis
What is EIQ Analysis?
EIQ Analysis is a analytical methodology evaluating correlations among E (Entry: Destination), I (Item: Product SKU), and Q (Quantity: Volume) directly from shipping history datasets. Its origin stems from traditional "assortment sheets (seed tables)" utilized in warehouse floor piece-picking operations.
In Tera Calculation, this EIQ framework is enhanced into "SEIQ" by incorporating physical product dimension attributes (S: Size), embodying conversions into practical engineering units such as cases, pallets, cubic volumes, and gross weights.
Primary Analytical Outputs
1. EIQ Table (Assortment Sheet)
A massive matrix table arranging SKUs along the vertical axis and shipping destinations along the horizontal axis.
- Key Feature: SKUs are sorted and displayed in descending order of piece shipping quantity.
- Real-world Example: At a scale of 430 destinations × 1,984 SKUs, data volume expands beyond what human eyes can read at a single glance.
- Analytical Insight: Blank entries appearing among top-ranking destinations reveal operational practices where shipping dates are intentionally staggered (e.g., handling emergency orders only while suspending standard shipments on specific days).
2. EIQ Scatter Plot
A visual chart representing each cell of the EIQ table as a plotted dot based on order presence, visualizing the entire shipping dataset on a single screen.
- Function: Ideal for intuitively grasping overall dataset distribution trends, though reading detailed volume quantities (Q) directly from plots is difficult.
3. EIQ Matrix Table
A consolidated summary table dividing the full EIQ table into 25 distinct blocks (5 SKU blocks × 5 Destination blocks).
- Practical Advantages: Provides a highly manageable classification scheme when evaluating material handling equipment selection and assigning facility zone capacities.
- Flexible Computation: Displays converted values in practical logistics units—such as case counts, pallet loads, and cubic volumes—alongside piece quantities.
- Rankey Ratios: Tera Settings define relative volume ratios (Rankey ratios) assigning percentage weights across blocks against a 100% total, allowing parameter adjustments during data processing.
Subsection 1 Creating EIQ Tables
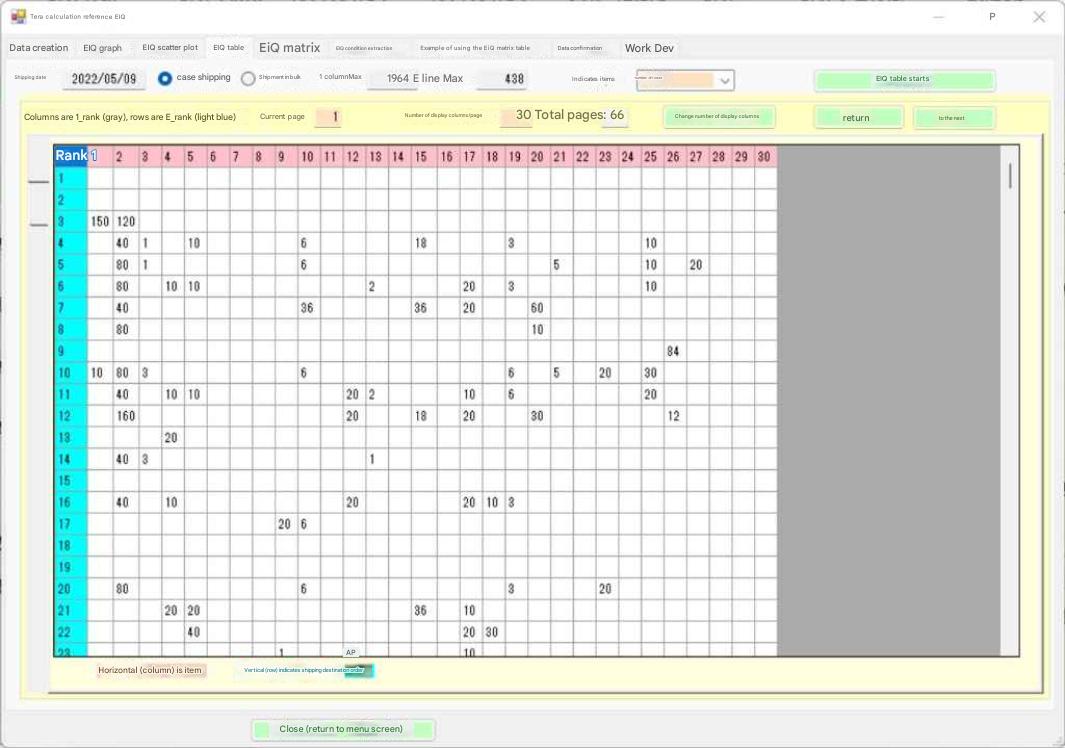
The table presents shipping history data for date 2022/05/09, with SKUs sorted in descending order of piece volume across all shipping data records.
Destination ranks 1 and 2 show blank cells due to zero shipments on this date; scrolling displays values across all 438 destinations.
Because total SKU count reaches 1,984 items, data display is split into 66 paginated views to optimize PC processing speeds and screen rendering.
Measuring 430 rows × 1,984 columns, raw table views cannot be evaluated by human inspection alone.
Observations:
Destination columns 1 and 2 exhibit blank cells above. These blanks indicate top 1 and 2 accounts received no shipments on this date; lower-tier emergency SKUs were dispatched, but standard shipments were suspended for the day.
Operational strategies that intentionally stagger dispatch schedules across specific weekdays exist across many distribution centers.
Subsection 2 Creating EIQ Scatter Plots
An EIQ scatter plot represents each cell of the EIQ matrix table as a plotted point, rendering the entire dataset on a single screen.

The diagram above plots active order cells to display the full EIQ dataset simultaneously.
While overall distribution trends become immediately visible, deriving exact volumetric throughputs directly from plots remains impossible.
Subsection 3 Creating EIQ Matrix Tables
An EIQ matrix table summarizes EIQ data divided into 25 blocks (5 SKU blocks × 5 Destination blocks).
Field experience confirms this 25-block partitioning represents an optimal grouping when allocating equipment and sizing facility zones during system design.
This table computes values converted into cases, pallets, or cubic volumes on demand.
Values are displayed alongside traditional calculation methods to facilitate comparative learning.
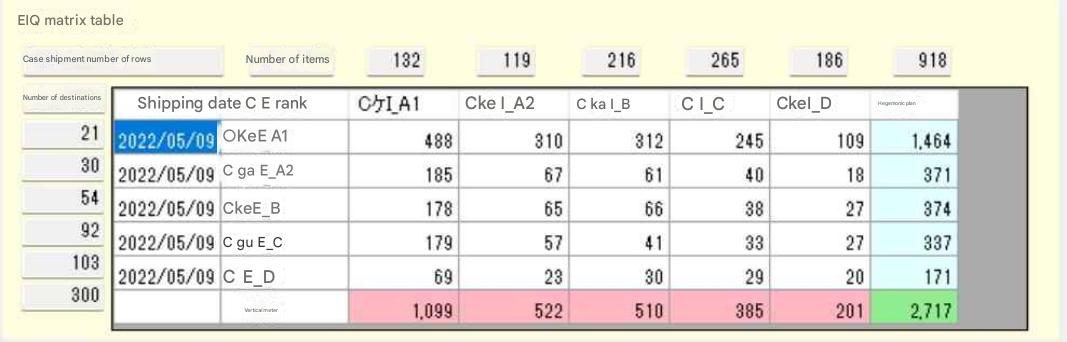
The table indicates that block CケI_A1 (comprising 132 SKUs) processed 1,099 shipping order line records. Top 21 destinations in block CケE_A1 accounted for 488 lines, block CケI_A2 accounted for 185 lines, and block CケI_A1 total shipments reached 1,009 lines across 300 destinations.
Observations:
In Tera Settings, EIQ matrix tables allocate percentage volume weights (Rankey ratios) across blocks against a 100% total as shown below.
For Rankey classification details, refer to "Chapter 2 Tera Calculation 0: Shipping Data Processing".
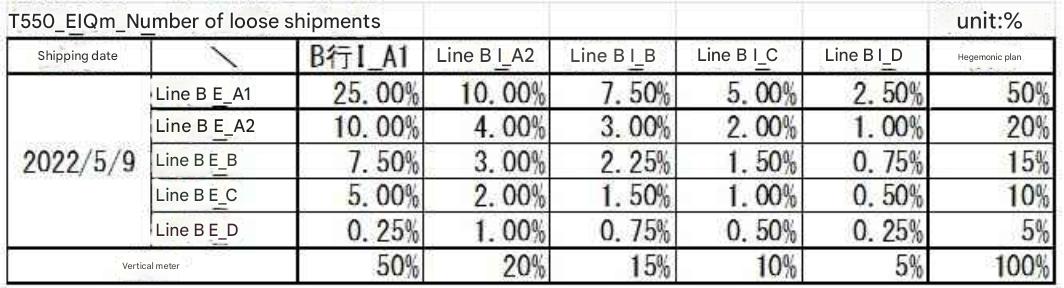
Block percentage ratios can be adjusted by modifying Tera Settings during Tera Calculation 0 data processing.
Rank classifications are established by analyzing full shipping datasets. Executing EIQ matrix summaries filtered by specific individual shipping dates will exhibit minor percentage ratio deviations.