Section 3 Automated Calculation Data Processing for Scale Calculation (Calculating Optimal Inventory)
Difference in Data Processing Between Tera Calculation 1 and Tera Calculation 2
While utilizing identical shipping datasets, the primary focus of data processing differs depending on the objective.
| Item | Tera Calculation 1 (Shipping Data Analysis) |
Tera Calculation 2 (Distribution Center Scale Calculation) |
|---|---|---|
| Primary Purpose | Aggregating peak material volume | Aggregating required storage capacity scale (Optimal Inventory) |
| Emphasized Metrics | Equipment capacity & work burden on max shipping days | Average value across all shipping day throughput |
| Baseline Origin | Maximum shipping day | Overall shipping data average |
⚙️ Data Processing Characteristics and "Optimal Inventory" Calculation in Tera Calculation 2
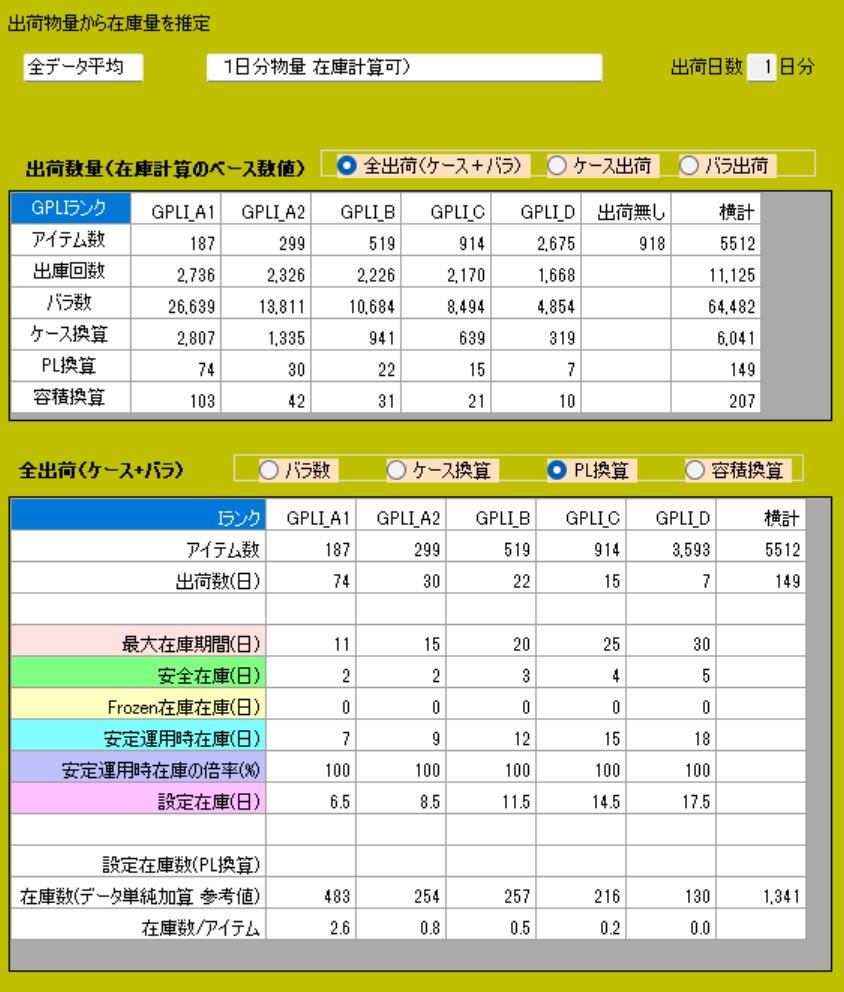
To determine the physical specifications of a distribution center (such as gross floor area) without waste, accurately calculating optimal inventory from shipping data is paramount.
- Emphasis on Pallet (PL) Conversion: Employs "PL Conversion" as the rank configuration key. This is designed to accurately compute storage space, which occupies the largest area percentage within the facility.
- Two Reasons for Adopting "Average Values":
- Prevention of Item Omission: Basing calculations strictly on specific peak shipping days causes items with no shipping activity on those particular days to be omitted from calculations.
- Suppression of Over-Investment: Designing floor area based on peak days results in an excessively oversized facility. In this system, baseline inventory is derived from average shipping data, while volumes exceeding the average are managed by factoring in safety inventory and fluctuating inventory.
- Separation of Shipping Units: In line with other calculations, case shipping and piece shipping are strictly differentiated and processed separately.
💡 Components of "Optimal Inventory" Derived from Shipping Data
In Tera Calculation 2, rather than simply adding maximum values, a highly precise optimal inventory is calculated by combining the following elements based on actual shipping data:
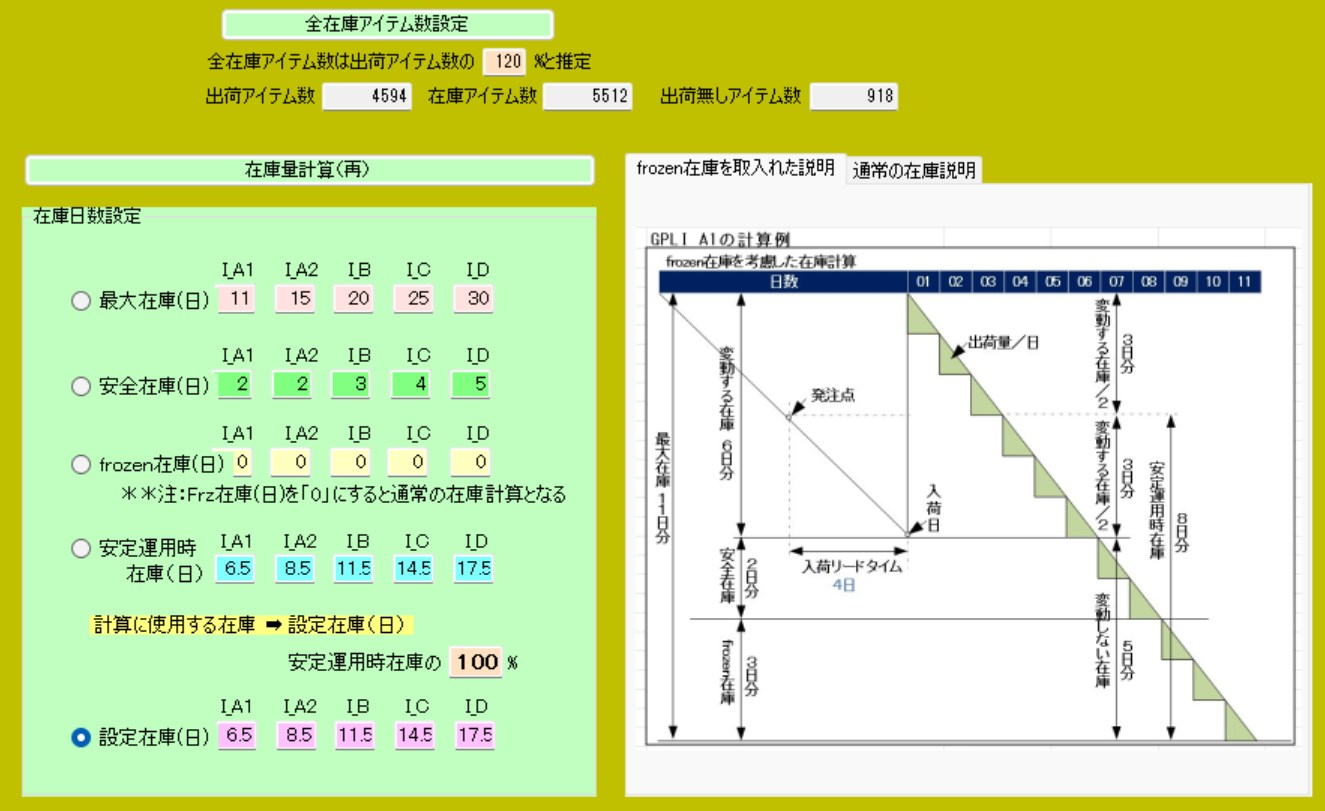
- Stable Operation Inventory: The baseline inventory volume required to run steady center operations without stockouts based on daily average shipping data.
- Fluctuating Inventory: Additional inventory built up to accommodate pre-predicted shipping volume fluctuations (waves) caused by seasonal factors, promotional campaigns, or sales events.
- Safety Inventory: Buffer inventory held to absorb unpredictable risks—such as sudden surges in demand or delivery delays due to inclement weather—and prevent stockouts.
Practical Implementation Points
- Verification Flexibility: While the standard default setting uses "Average Values", modifying Tera Settings allows calculating facility scale under "Specified Shipping Date" mode. Users can verify scale variances across settings to derive optimal design specifications (optimal inventory).
- Open Data Accessibility: Processed database tables in Access (containing piece counts, case, PL, volume, and weight conversions) are fully accessible, enabling users to perform customized independent analyses.
Tera Calculation 2 Data Processing Screen
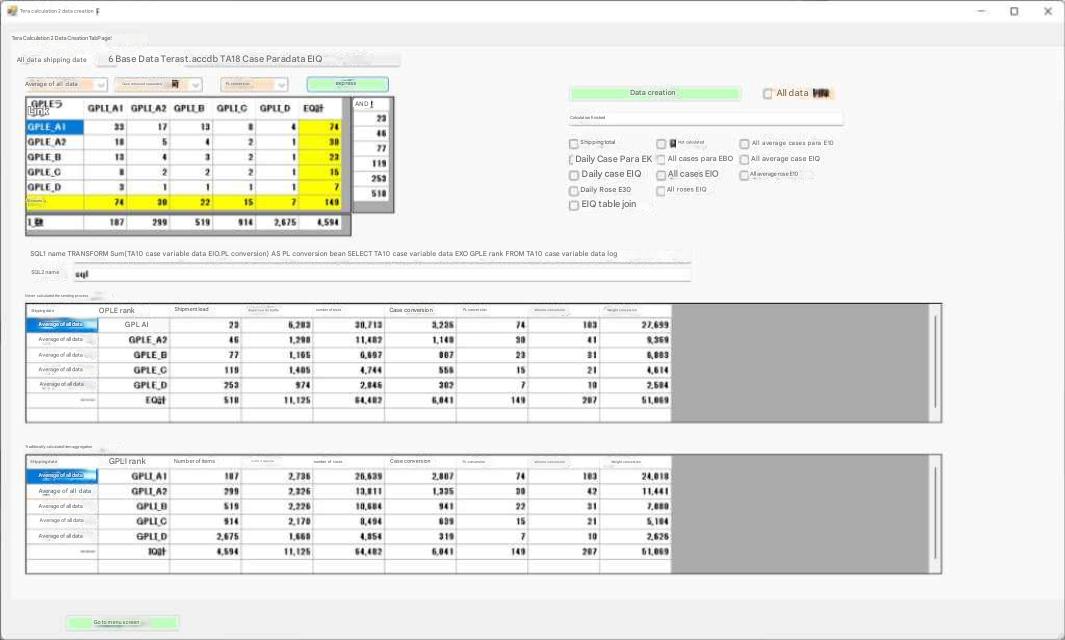
Tera Calculation 2 employs PL Conversion as its ranking configuration key.
This focuses on palletized storage within storage areas, which represent a major proportion of distribution center floor area.
Source data is obtained from table "T200", but calculated values adopt the overall shipping average as default (Tera Setting).
There are 2 main reasons for this:
1. Adopting a specific single shipping date causes items not shipped on that specific day to be omitted from calculations.
2. Adopting high-volume peak shipping days leads to an unnecessarily oversized distribution center.
By supplementing days with higher-than-average shipping through pre-configured safety inventory and fluctuating inventory, an efficient facility scale based on optimal inventory can ultimately be calculated.
Although overall data averages are adopted in default Tera Settings, calculations specifying individual shipping dates are also supported; users are encouraged to modify Tera Settings to verify scale variances.
As stated in other sections, case shipping and piece shipping are categorized and calculated separately.
These datasets contain piece counts along with case, PL, volume, and weight conversions; database tables are made publicly available so users can attempt custom calculations beyond Tera Calculation using these Access datasets.