Section 1 Contents of Shipping Data
This document explains the "Contents of Shipping Data" and "Concepts of Shipping Fluctuations", which serve as the foundation for distribution center design.
1. Structural Components of Shipping Data (EIQ + Alpha)
The foundation of logistics design is EIQ Analysis (Entry: Destination, Item: Commodity, Quantity: Volume). However, Tera Calculation adopts a data format that incorporates additional required fields to execute highly accurate engineering designs.
Basic EIQ Items
- Destination (E): The company name or store name to which products are delivered.
- Item (I): Product names or codes that can be distinguished at the SKU (Stock Keeping Unit) level.
- Piece Quantity (Q): The minimum unit for operational handling and inventory management.
Additional Items for Logistics Design
- Shipping Date / Time: Used for hourly volume aggregation and analysis of shipping "fluctuations" described below.
- Item Category / Shipping Category: Used for range filtering or exclusion of specific products/destinations.
- Shipping Route: Used to manage groups loaded onto the same truck.
- Conversion Parameters: "Case Quantity per Pack", "Pallet Case Stacking Capacity",
"Case Volume & Weight", etc. Using these parameters, piece
counts are converted into physical logistics units (cases, pallets, volume).
Subsection 1 Shipping Data Fields
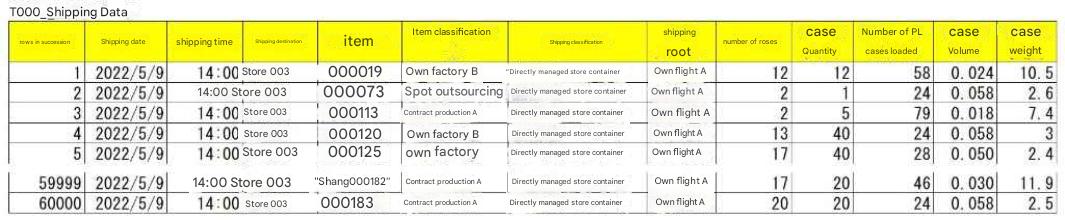
A distribution center ships products based on customer orders; the compilation of these historical shipping results is called shipping data.
It is a record of E (Entry), I (Item), and Q (Quantity), such as "Shipped 10 units of Product B to Destination A".
In Tera Calculation, designing a distribution center is impossible using only basic EIQ information, so necessary fields have been added.
The following data fields represent the structure of the shipping dataset:
Row Sequence No. Order sequence of shipping data records (sequential number assigned to each record).
Shipping Date Date on which shipping occurred (shipping data contains multiple shipping dates).
Shipping Time Time at which shipping occurred; used for hourly material throughput aggregation.
Destination (E) Company name or store name where products are delivered.
Item (I) Product name or product code (must be distinguishable at SKU level).
Item Category Field used to extract or exclude specific ranges of items during data analysis; enter "Unspecified" if not needed.
Shipping Category Field used to extract or exclude specific ranges of destinations during data analysis; enter "Unspecified" if not needed.
Shipping Route Route name representing a group of destinations loaded onto the same truck, or route name managing destinations divided into multiple delivery groups.
Piece Quantity (Q) Minimum unit (SKU) for operational tasks and inventory control.
SKU (Stock Keeping Unit): The smallest management unit for order processing and inventory control, distinguishing differences in case quantity or dimensions even for the same product.
Quantity per Case Field used to calculate case conversion and distinguish/calculate quantities for case-unit versus piece-unit shipping.
Pallet Case Capacity Field used to calculate pallet conversion (hereafter referred to as PL conversion), representing the number of cases stacked onto a designated pallet footprint.
Case Volume / Weight Fields converting piece quantity into physical volume (calculated post case conversion) and weight (calculated post case conversion).
Regarding shipping data used in Tera Calculation (refer to attached Excel), column order and field names cannot be altered.
Please understand this as a strict rule when importing shipping data into Tera Calculation.
3. Scale Perception of Analysis Datasets
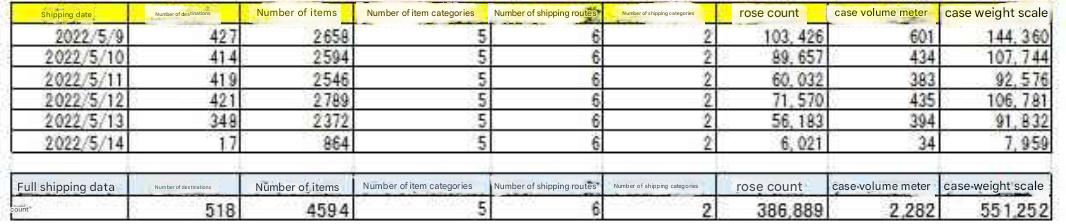
In the example presented in reference materials (assuming a B2B distribution center for small home appliances and electronic equipment), data of the following scale is handled:
- Record Count: 60,000 rows.
- Positional Scale: Corresponds to upper-medium scale to lower-large scale.
Shipping Data Simple Summary
Shipping dataset contains 60,000 records.
Is the distribution center scale positioned from upper-medium to lower-large scale?
Industry profile assumes a distribution center primarily handling B2B small appliances and electronic equipment.
Subsection 2 Fluctuations in Shipping Data
2. Shipping Fluctuations and Economical Scale Design
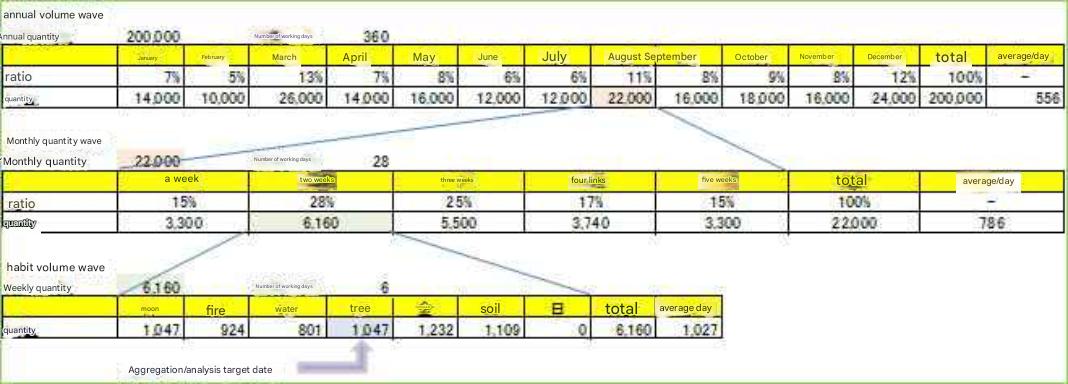
Shipping volume is not constant every day; it increases or decreases depending on season, month, day of the week, weather, and new store openings. This phenomenon is called "Shipping Fluctuation".
Corporate sales exhibit shipping fluctuations by season, month, and day of the week, with shipping material throughput directly linked to sales.
Additionally, it is necessary to consider that product volume may vary seasonally (summer vs. winter goods) depending on industry sector.
Designing a distribution center tailored to peak shipping fluctuation dates results in an excessively large and highly uneconomical facility.
Methodology for Achieving an "Economical Scale" Distribution Center
Designing a facility matching maximum peak volume (the top of shipping fluctuations) creates vast wasted space during off-peak periods, rendering it uneconomical. Tera Calculation presents a philosophy of deliberately selecting a target date that is not the absolute peak day (e.g., Thursday rather than the weekly MAX day).
- Peak Period Countermeasures: Instead of over-sizing facility scale, peak periods are managed through the following operational measures:
- Extending operating hours, increasing workforce staff.
- Outsourcing to external facilities, advancing shipping operations ahead of schedule.
- Company-Wide Consensus: Because these operational measures impact purchasing and sales departments, building consensus across departments is essential.
To design an economically scaled distribution center, check how much variance exists between calculation-adopted shipping data and peak shipping dates, and verify what countermeasures can be taken during peak periods.
Countermeasures include extending operating hours, adding workers, requesting external facility support, and advancing shipping schedules (operational adjustments).
Because these measures affect purchasing and sales departments beyond logistics, explanations must be presented to related divisions to secure company-wide agreement.
The table above is a material throughput fluctuation table created to determine target analysis dates for planning a distribution center suited to August throughput volumes.
The intention behind selecting Thursday—which is not the weekly MAX volume day—as the target date is to manage peak-day volumes through extended operating hours, extra staffing, or outsourcing, thereby maintaining the distribution center at an economical scale.
Logistics fluctuations occur not only yearly, monthly, or weekly, but also due to public holidays, weather, and customer store network expansions.