Chapter 2. ABC Analysis
I. IQ Data Analysis (Analysis by Item)
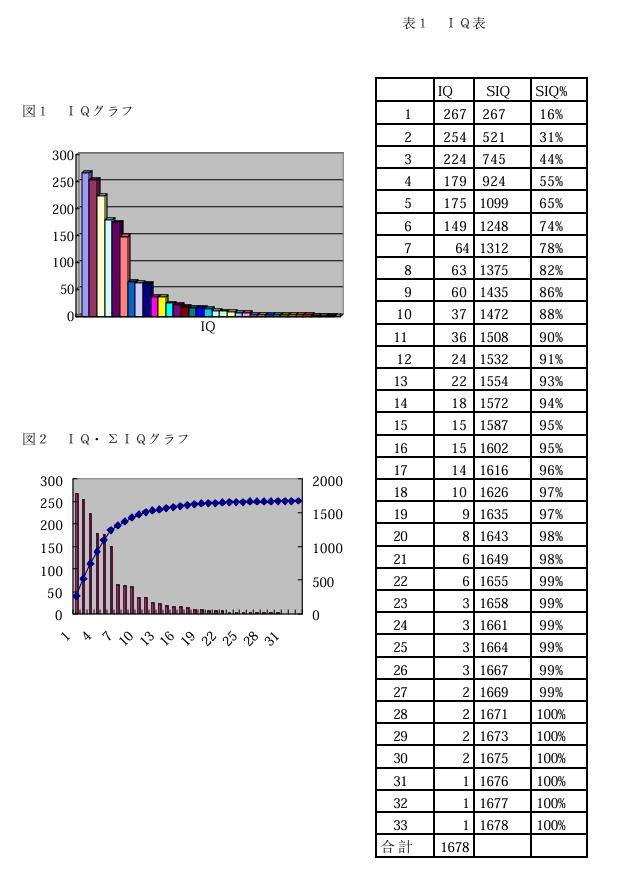
IQ Analysis is a method of analyzing the shipping volume (Quantity) for each item (Item).
- Utilization of ABC Analysis
Items are arranged in descending order of shipping volume and classified into three groups: A (large volume), B (medium volume), and C (small volume). This is indispensable for inventory management and distribution center planning.
- Application of the "80/20 Rule"
Generally, there is a tendency for 20-30% of all items (I20-I30) to account for 80% of the total shipping volume (GIQ80).
- Analysis Tools
- IQ Table: A table summarizing quantities and cumulative composition ratios.
- IQ Curve (Pareto Chart): A graph visualizing the distribution of shipping volume. A "ΣIQ Curve" indicating the cumulative value is sometimes shown together.
- ABCD Analysis
From the C group, items that hardly move or are never shipped, known as "Dead stock," are distinguished as the D group to evaluate inventory health.
II. EQ Data Analysis (Analysis by Customer)
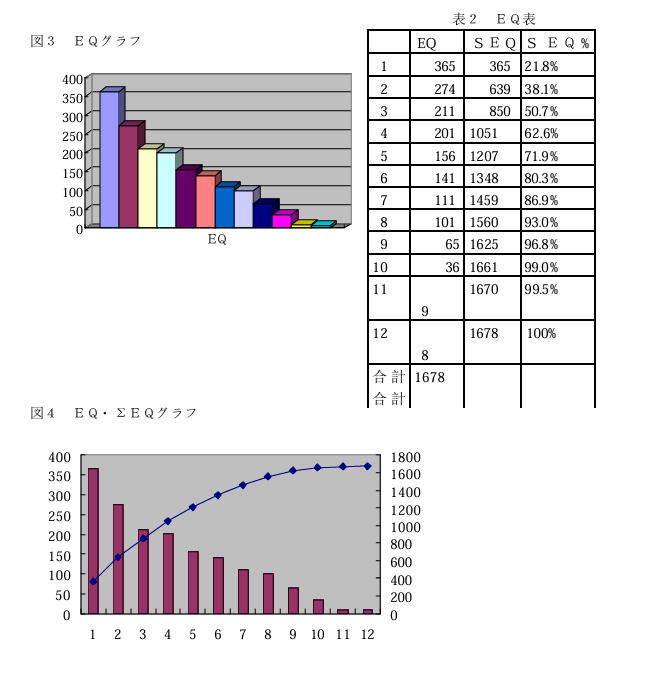
EQ Analysis is a method of analyzing the order quantity (Quantity) for each ordering customer (Entry/Order Entry).
- Importance from a Logistics Perspective
By analyzing on a "quantity" basis rather than a sales amount basis (commercial flow), the load of logistics work can be accurately grasped.
- Distribution Trend
Similar to IQ analysis, it is common for 20-30% of all customers (E20-E30), the key clients, to account for 80% of the total order volume (GEQ80).
- Analysis Tools
- EQ Table: A table ranking the order quantity for each customer.
- EQ Curve: A graph visualizing the bias per customer. You can check if the logistics load is concentrated on specific customers.
Summary: Roles of IQ Analysis and EQ Analysis
- IQ Analysis: Determines "which items should be managed intensively (storage location and replenishment frequency)".
- EQ Analysis: Determines "which customers (shipping destinations) have a large impact (packing and delivery routes)".
By combining these two analyses, it becomes possible to construct an optimal layout and work structure for a distribution center.