2. Data Analysis Methods and Procedures
2-8. Analysis Procedures and Practical Approach (Detailed Technical Explanation)
To establish absolute mathematical facts for distribution center engineering and system proposals, data analysis is performed step-by-step through the following 9 logical procedures. Below is a detailed explanation of each step's operational objective and logic.
-
Step 1: Data Cleansing & Database Import
Raw shipment logs (CSV/Excel files), item masters, and customer masters supplied by clients almost always contain format inconsistencies, duplicates, and missing codes. We first perform rigorous data cleansing and then import the cleaned dataset into a high-capacity relational database (such as Access or SQL Server).
Within Tera Calculation, data is stored as the "T000_ShipmentData" table inside a freshly initialized database environment using a standardized schema. At this stage, control totals (total row counts, total piece quantities) are recorded to establish baseline benchmarks for double-checking data integrity in subsequent analytical stages.
-
Step 2: Relational File Mapping & Physical Unit Conversion
Primary relationships (joins) are established between the imported shipment log and item master files (pack sizes, cases per pallet, case volume, gross weight) as well as destination masters using key fields (item code, customer code). Linking physical dimensions to order lines transforms transactional data into physical volume metrics required for engineering.
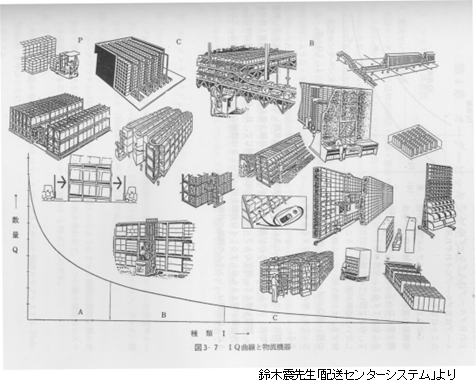
[Unit Conversion Mechanism & Engineering Value (Tera Calculation 0)]
Because raw shipment order lines state only "Piece Counts (ordered quantity)", Tera Calculation 0 automatically calculates physical equivalents for every record line upon database import:
・Case Equivalent = Piece Count ÷ Case Pack Size
・Pallet (PL) Equivalent = Case Equivalent ÷ Cases per Pallet
・Volume Equivalent (m³) = Case Equivalent × Case Volume
・Weight Equivalent (kg) = Case Equivalent × Case Gross WeightEngineering Value: Transforms order piece quantities into volumetric and gravimetric space/weight requirements needed to size storage racks, AS/RS cells, forklift/conveyor throughput, and truck payload capacities. These conversion values are stored across all record lines as the foundation for matrix aggregations.
-
Step 3: Multi-Axis Aggregation & Target Day Selection
Using database queries, multi-dimensional aggregations (line counts, cases, pallets, volume) are executed across annual, monthly, weekly, daily, and hourly timeframes. This visualizes volume volatility and peak characteristics caused by seasonality, month-end spikes, and promotional campaigns.
A crucial engineering principle is to avoid designing facility capacities around maximum peak days. Sizing buildings and machinery to absolute peak spikes causes vast idle space and excessive capital expenditure during normal periods. In Tera Calculation, a standardized high-demand day (such as a representative weekday target day) is selected as the baseline. Peak-day surcharges are addressed through operational strategies, such as shift extensions, temporary staffing, third-party warehousing, or pre-picking workflows.
-
Step 4: Process Flow Mapping & System Concept Definition
Physical operational flows (receiving, inspection, putaway, bulk storage, replenishment, picking, sorting, packing, staging, and loading) within the target distribution center are mapped into a visual operational flow diagram.
Inbound unit loads (single-SKU pallets vs. mixed-case pallets) and automated replenishment routes to pick faces (flow racks, shelving) are mapped. Structuring this material flow beforehand clarifies EIQ aggregation boundaries and system concepts regarding equipment placement.
-
Step 5: Future Projection Dataset Generation (Target-Day Base)
Designing a facility purely on historical performance data risks obsolescence as business grows or product lines change. Therefore, future growth parameters are applied to the target-day baseline data established in Step 3 to generate "Future Projection Datasets."
Parameters include annual volume growth rate (%), SKU expansion forecasts, destination network changes, and seasonal assortment shifts derived from corporate business plans. Using future-adjusted datasets ensures facility designs can seamlessly accommodate business expansion 3 to 5 years post-launch.
-
Step 6: Target-Day EIQ Matrix, PCB Analysis & Equipment Allocation
Future-projected target-day datasets undergo core "EIQ Matrix Analysis" and "Data Characteristics Analysis (PCB Analysis)" in Tera Calculation 1. Unlike traditional 3-tier ABC analysis, volume is cross-aggregated into a 25-block matrix (5 Item Tiers × 5 Destination Tiers).
[Why Segregate Shipment Data into Case vs. Piece Orders?]
Segregating order logs into "Full-Case Shipments" and "Loose-Piece Shipments" is essential because workflows, storage zones, automation machinery, and labor costs differ fundamentally between them.
- Case Shipping Characteristics: Handled as unopened master cartons retrieved directly from bulk storage (pallet racks, AS/RS). Requires a single pick action per case, incurring low labor cost. Suitable for palletizers, case conveyors, and sorters.
- Piece Shipping Characteristics: Cartons are opened to pick individual units. Involves pick faces (flow racks, shelving), DPS (Digital Picking Systems), checking, and repacking into outbound cartons. Picking 10 individual units requires several times the labor and cost compared to picking 1 full case.
Combining case and piece shipments hides labor-intensive piece-picking requirements within bulk volumes, leading to inaccurate picking face sizing and labor allocation. Tera Calculation automatically segregates case and piece workflows.
[Data Characteristics Analysis: Importance of PCB Analysis (Pallet / Case / Bara)]
Evaluating shipping handling units through PCB Analysis is vital for facility layout engineering. Orders are automatically categorized into three handling tiers:
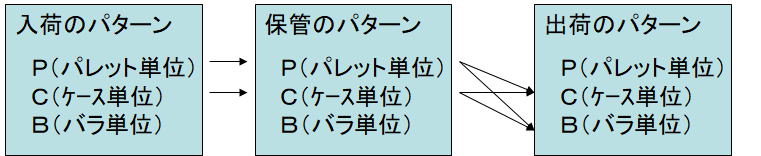
- P (Pallet Shipping): Bulk orders dispatched on full pallets directly. Handling labor is minimal using forklifts or pallet AS/RS.
- C (Case Shipping): Orders dispatched in full case units. Suitable for case AS/RS, palletizers, case conveyors, or direct bulk storage picking.
- B (Bara / Piece Shipping): Loose-piece picks or broken-case orders. Requires dedicated picking faces (flow racks, shelving), DPS (Digital Picking Systems), or sorters, representing the majority of labor costs.
Goal of PCB Analysis: As shown in image23.jpg, determining the "P : C : B" ratio clarifies footprint allocation between bulk storage and piece picking zones, forming the foundation for material handling equipment selection.
[EIQ Matrix & Equipment Allocation Mechanics]
- Value of 25-Block Matrixing: Accurately captures two-dimensional flow velocity (e.g., how much volume flows from high-velocity Item A1 to high-velocity Destination A1), enabling shortened travel paths and concentrated automation placement.
- Interactive Equipment Mapping: Specific equipment types (AS/RS pallet automated storage, electric mobile racks, flow racks, shelving, automated sorters) are mapped to item tiers, directly calculating throughput volumes (cases, pallets, lines, volume) passing through each system.
- Standardized Naming Conventions: Systematic codes such as "C_Case_E_A1" (Case Shipping, Case Key, Destination Tier A1) or "B_Line_I_A1" (Piece Shipping, Line Key, Item Tier A1) allow unambiguous identification of complex aggregated data blocks.
-
Step 7: Inventory / Inbound Estimation & Hourly Schedule Validation
Theoretical inventory holding requirements and daily inbound volumes are back-calculated from outbound demand data using mathematical models.
Stable Operating Inventory (Theoretical Capacity) = Safety Stock + (Cycle Stock ÷ 2)
* Cycle Stock = Max Inventory - Safety Stock (Daily demand uses overall historical average)[Dead Stock Integration & Hourly Schedule Validation]
- Accounting for Non-Moving Dead Stock: Slow-moving or inactive inventory items with zero outbound activity during the sample period occupy physical rack space. Tera Calculation automatically adds these non-moving SKUs into Piece Shipping Tier D during inventory calculations to accurately size total storage volumes and required rack locations.
- Hourly Operational Schedule Validation: Time-slot throughputs are simulated from dock receiving to shipping. Working backward from departure deadlines, operational time lags between upstream activities (picking, replenishment) and shipping are evaluated to ensure required throughputs align perfectly with system capacities without bottlenecking.
-
Step 8: EIQ Matrix Data Output & Custom Reporting in Excel
Completed analytical outputs in Tera Calculation (summary totals, PCB handling unit breakdowns, EIQ scatter plots, 25-block EIQ matrix tables, equipment throughput tables, inventory/inbound estimations) are directly exported into Microsoft Excel via data grid views.
[Excel Output & Custom Visualization Process]
Exported datasets contain both absolute physical units (cases, pieces, volume m³, gross weight kg) and percentage composition data (100% total base). Engineers utilize these structured outputs to produce presentation graphics and custom summary tables:
- PCB Ratio Pie Charts (P : C : B Breakdown): Proportion charts illustrating the balance between Pallet, Case, and Loose Piece shipments.
- Volume Fluctuation Charts: Comparative charts highlighting peak versus target-day operational gaps.
- Pareto Charts (5-Tier Cumulative Curves): Cumulative velocity curves demonstrating SKU and destination volume concentration (20/80 rule evaluation).
- 25-Block Heatmaps: Color-coded matrix heatmaps visually emphasizing high-velocity concentration zones (A1×A1 zones).
- Equipment Throughput Pie Charts: Proportion charts demonstrating volume distribution across AS/RS, flow racks, and mobile shelving.
-
Step 9: Integration into Technical Proposals & Design Rationale
Visualized tables and charts generated in Step 8 are embedded into "Chapter 1: Design Prerequisites" and "Chapter 2: Technical Rationale (Equipment Sizing & Area Calculations)" of the formal logistics engineering proposal.
Providing quantitative, fact-based answers to questions like "Why is this AS/RS required?" or "How was this square footage calculated?" delivers convincing proof to client executive management and logistics leaders, producing high-trust technical proposals.