Logistics AI "TCalc EIQ_AI" Screen Images & Functional Explanation
TCalc EIQ_AI is a logistics AI system designed to make future predictions using machine learning based on historical shipping data.
It is equipped with features to create and train model data—which serves as the foundation for logistics simulations—as well as features to execute AI forecasts using trained models.
Here, we explain each screen image of the system along with its detailed
roles and mechanisms.
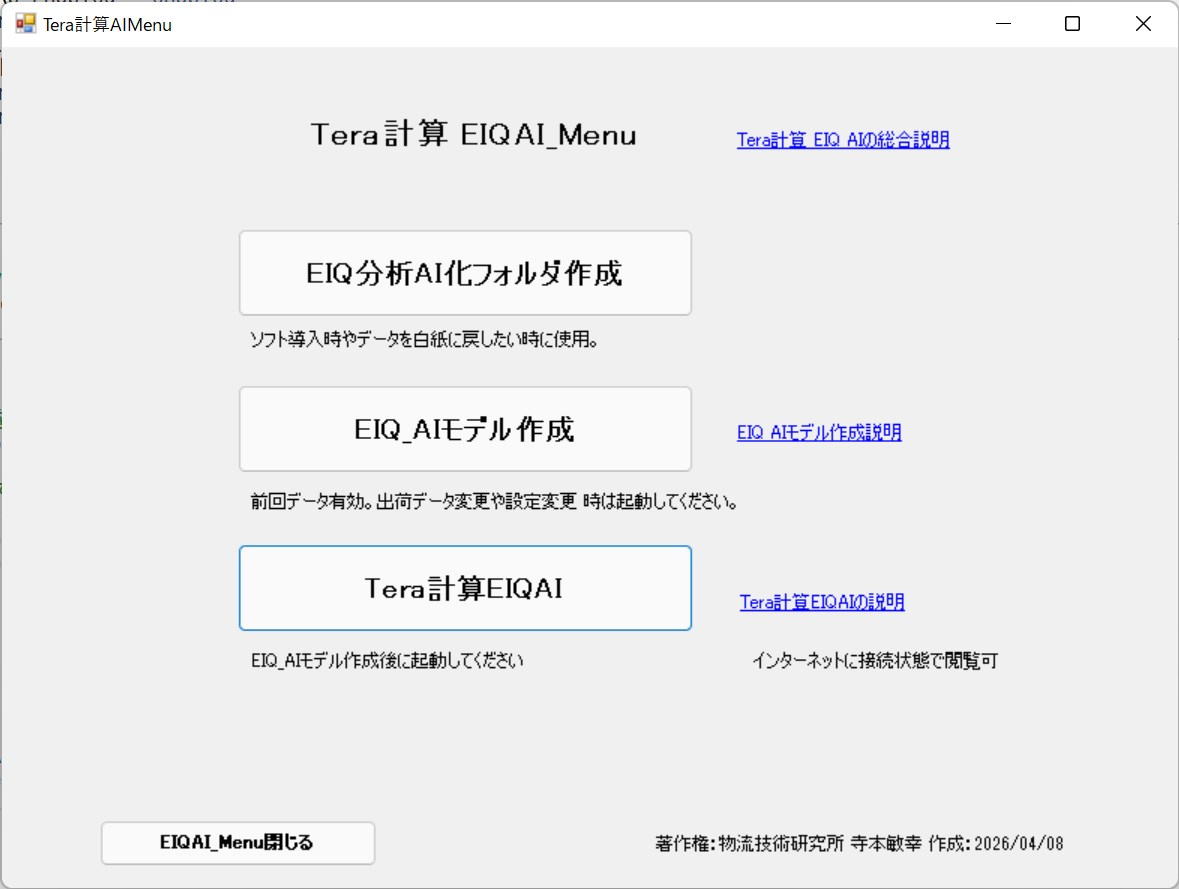
Menu Screen for Creating Machine Learning Model Data
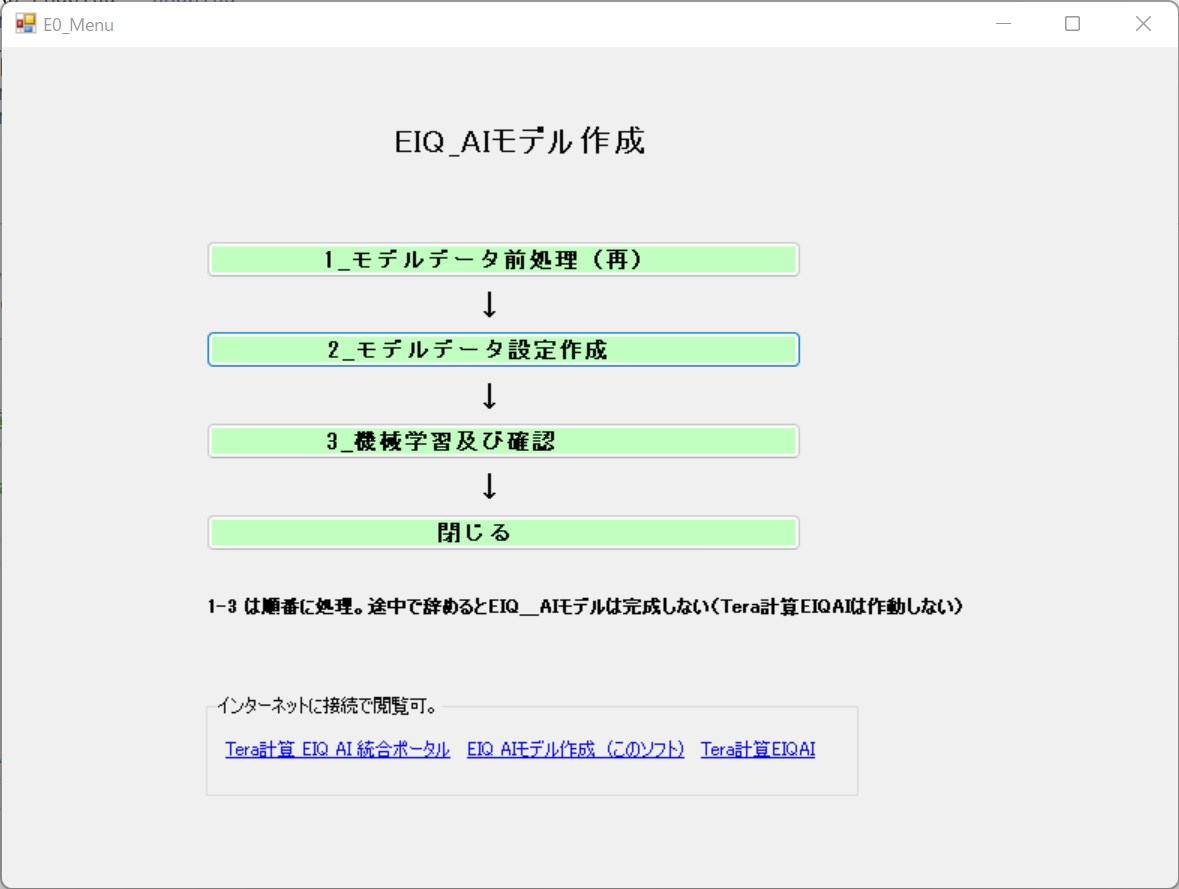
Explanation:
An intuitive and easy-to-understand main menu screen that serves as the starting point for creating "model data" to train the logistics AI.
From here, users can smoothly transition to loading past historical data,
configuring various parameters for AI training, and accessing actual calculation
and processing screens.
Acting as a control center governing the entire system, it is designed so that even first-time users exploring logistics simulations can operate it without confusion.
No complex programming knowledge is required; simply clicking buttons prepares
everything for advanced AI predictions.
Screen for Loading Baseline Shipping Data for the Model
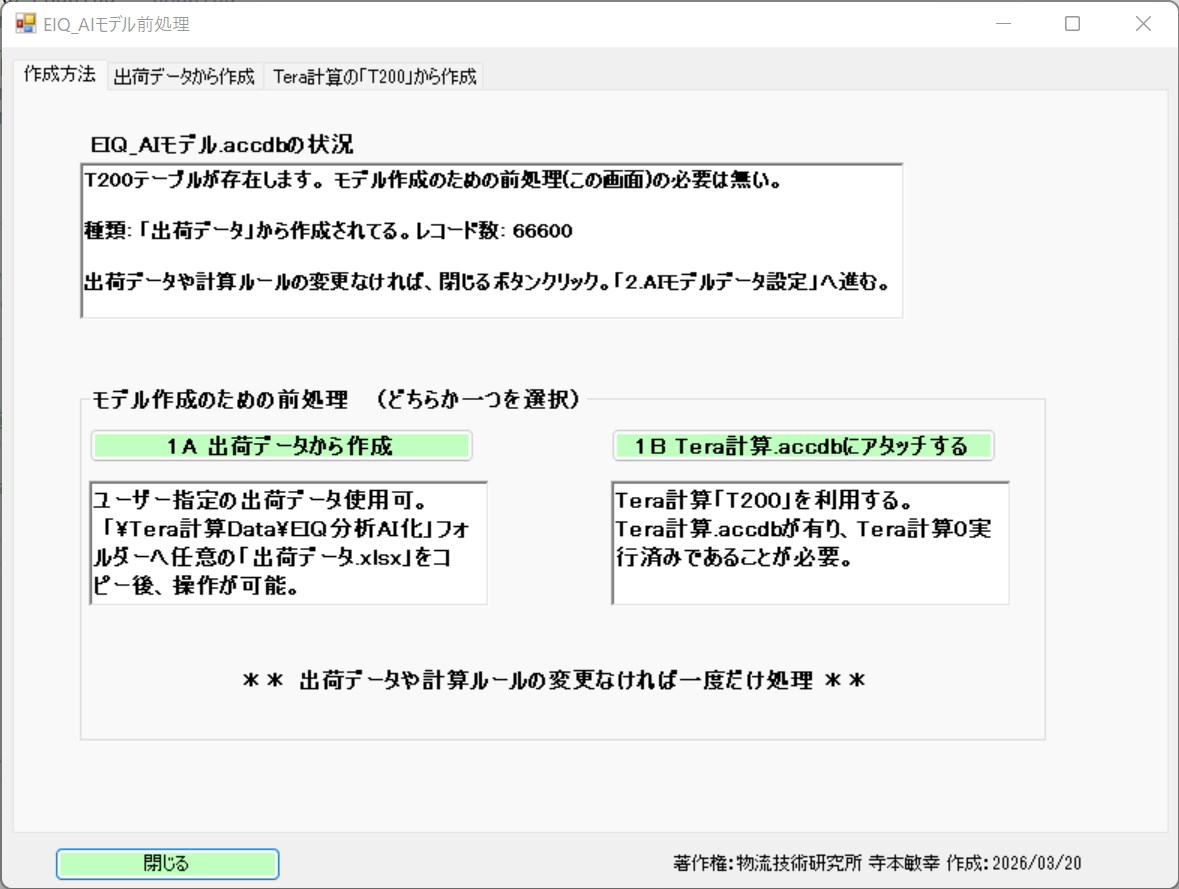
Explanation:
A screen to directly import past operational shipping data (CSV or Excel format), which forms the foundation of machine learning.
The raw data loaded here becomes the "training seed" required
to accurately predict future logistics fluctuations.
During import, the system validates the content and automatically organizes
it into a clean state suitable for AI processing.
By inputting real operational records accumulated through daily business, users can achieve high-precision logistics simulations that deeply reflect their facility's unique operational DNA.
Screen for Setting Range and Model Count to Generate Model Data from Shipping Data
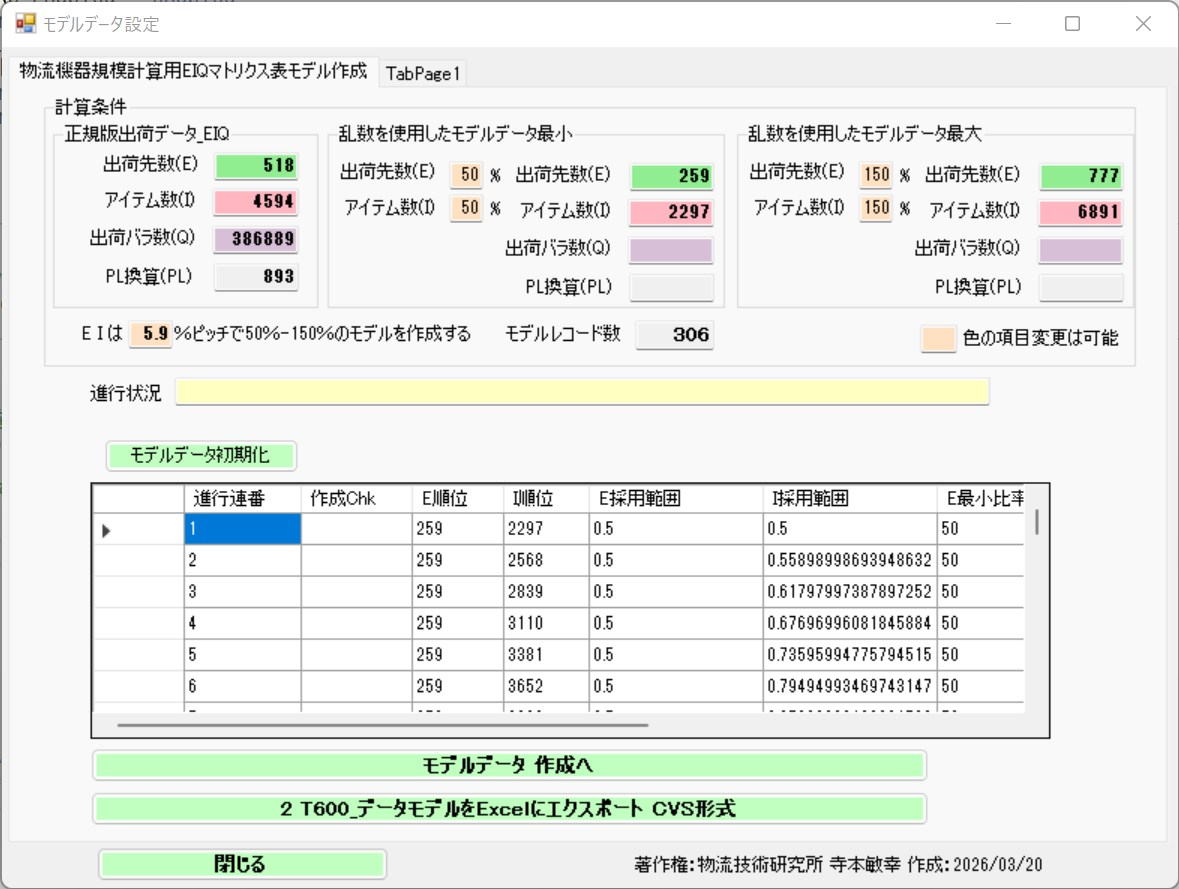
Explanation:
A key screen where users specify the generation range (e.g., E/I ratios from 50% to 150%) and granularity (pitch) for synthesizing simulation model data from imported shipping data.
Rather than merely learning past numbers, it intentionally constructs "virtual
future scenarios" where destinations (E) or SKU counts (I) scale up
or down dramatically.
Configuring flexible parameters based on objectives expands a single set
of shipping records into thousands of prediction model patterns.
This allows the logistics AI to comprehensively learn every scenario, from off-peak periods to extreme
volume spikes.
Screen for Setting Calculation Rules to Generate Model Data from Shipping Data
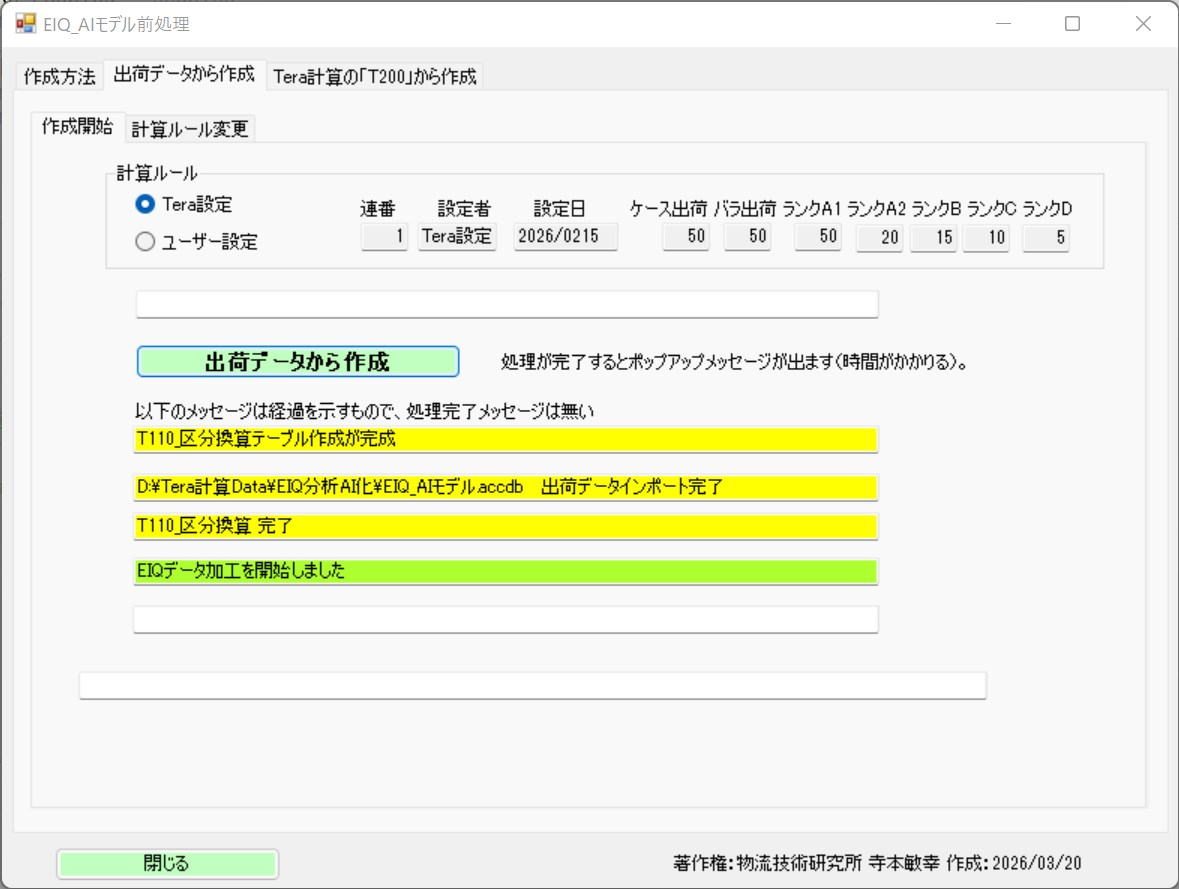
Explanation:
A screen to define custom calculation rules so that the logistics AI can accurately recognize operational patterns (features) instead of training on raw shipping data as-is.
Here, users finely define thresholds for ABC ranking based on Pareto analysis
and conversion rules for packaging units (loose, case, etc.).
This meticulous preprocessing transforms raw numerical logs into high-quality model data rich with operational meaning.
Reflecting physical constraints and commercial practices in the system enables practical logistics simulations aligned with real-world operations.
Screen Displaying Model Data Generation in Progress for Logistics Simulation
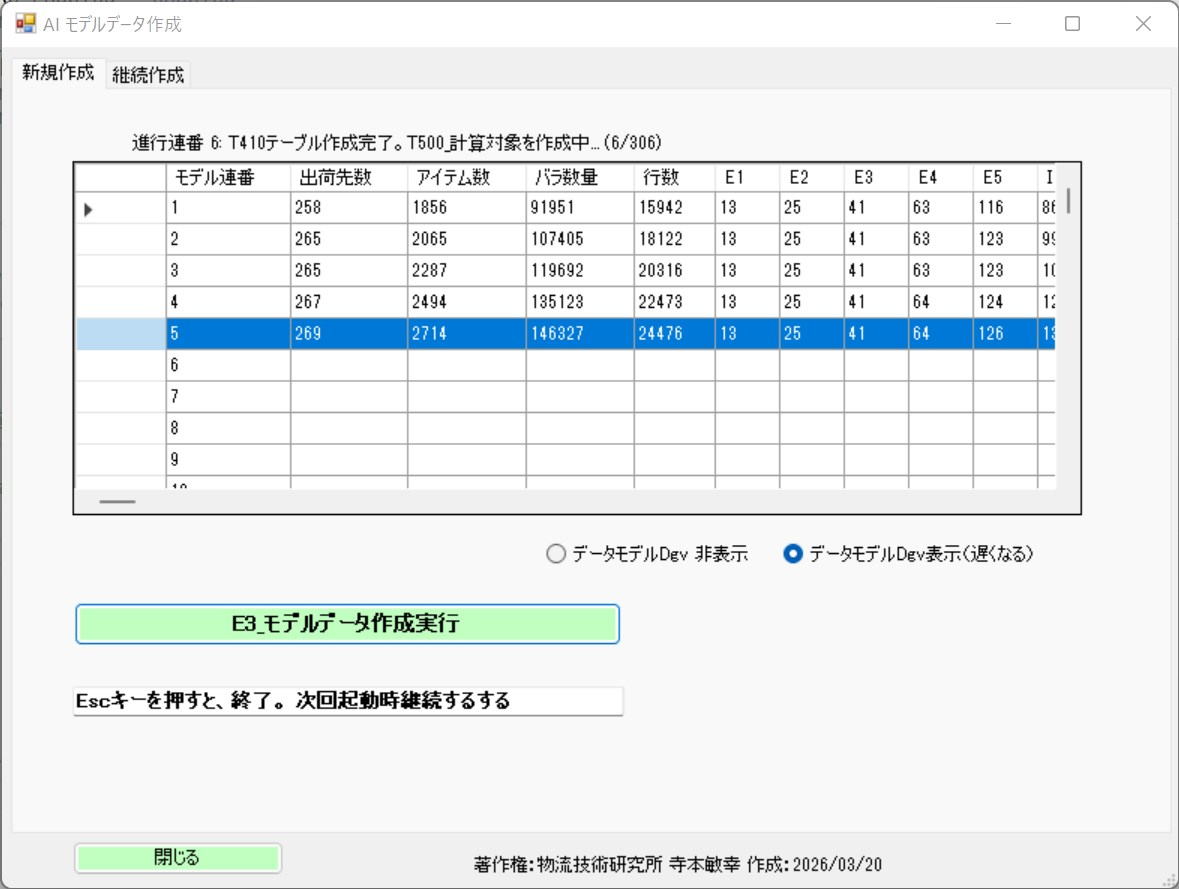
Explanation:
A batch processing screen where the system automatically synthesizes model data (T600 table) for machine learning based on configured virtual scenarios and calculation rules.
It executes rapid matrix calculations across 165 fields per record (loose,
case, volume, and weight values by rank), showing real-time progress via
a progress bar.
Featuring a pause and resume mechanism, it efficiently manages PC load and execution time when constructing complex logistics simulation spaces from extensive shipping data.
Screen for Machine Learning Execution on Generated Model Data
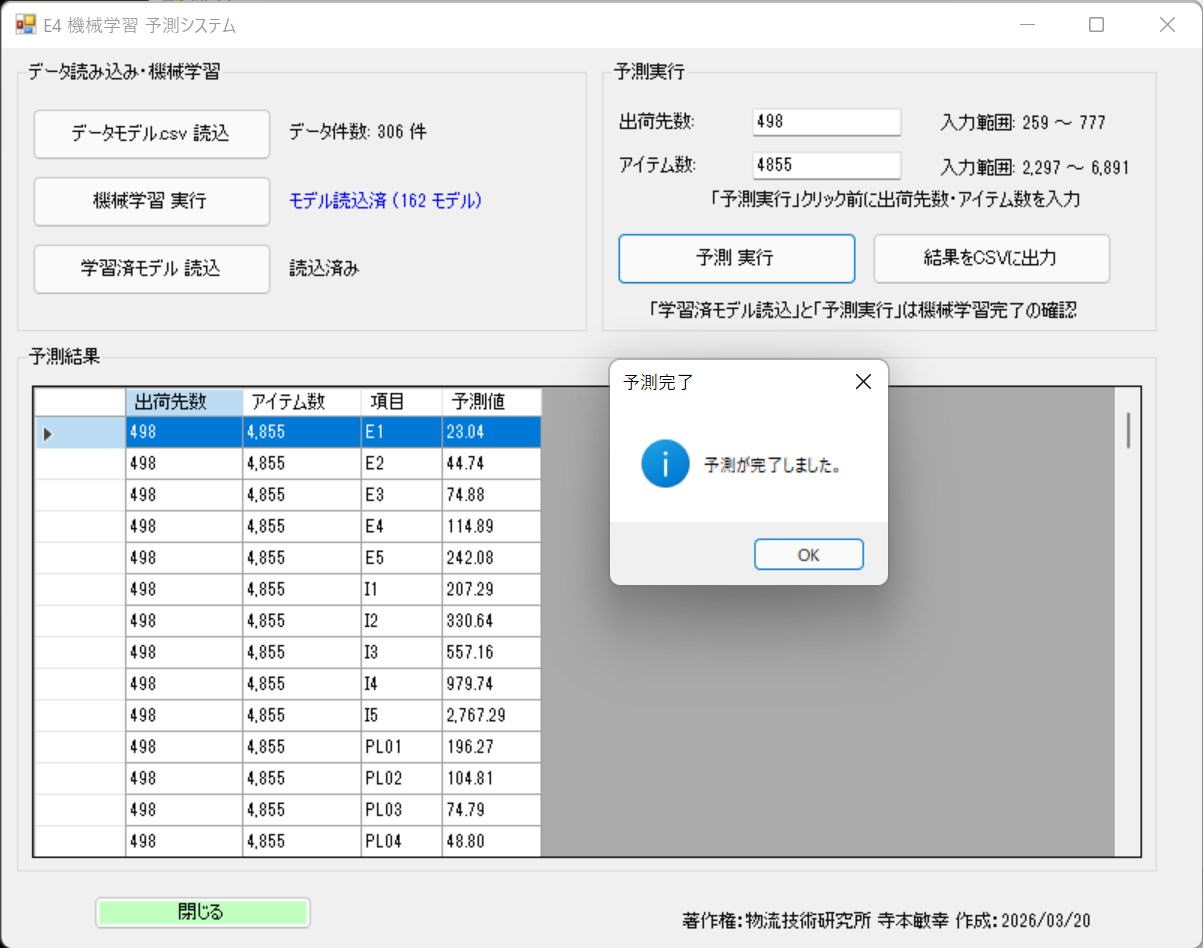
Explanation:
The core screen of the system, executing actual training for the logistics AI (machine learning engine) using thousands of generated model data patterns.
Utilizing the SDCA regression algorithm built into Microsoft's "ML.NET"
library, it constructs AI models for over 160 predictive output variables
simultaneously.
Through this training phase, the AI acquires full mastery of the "fractal laws" underlying the shipping data.
This completes a "predictive brain" capable of instantly computing
high-precision forecasts even when encountering unknown inputs.
Screen Displaying Forecast Simulation Figures from Logistics AI in EIQ_AI Tables
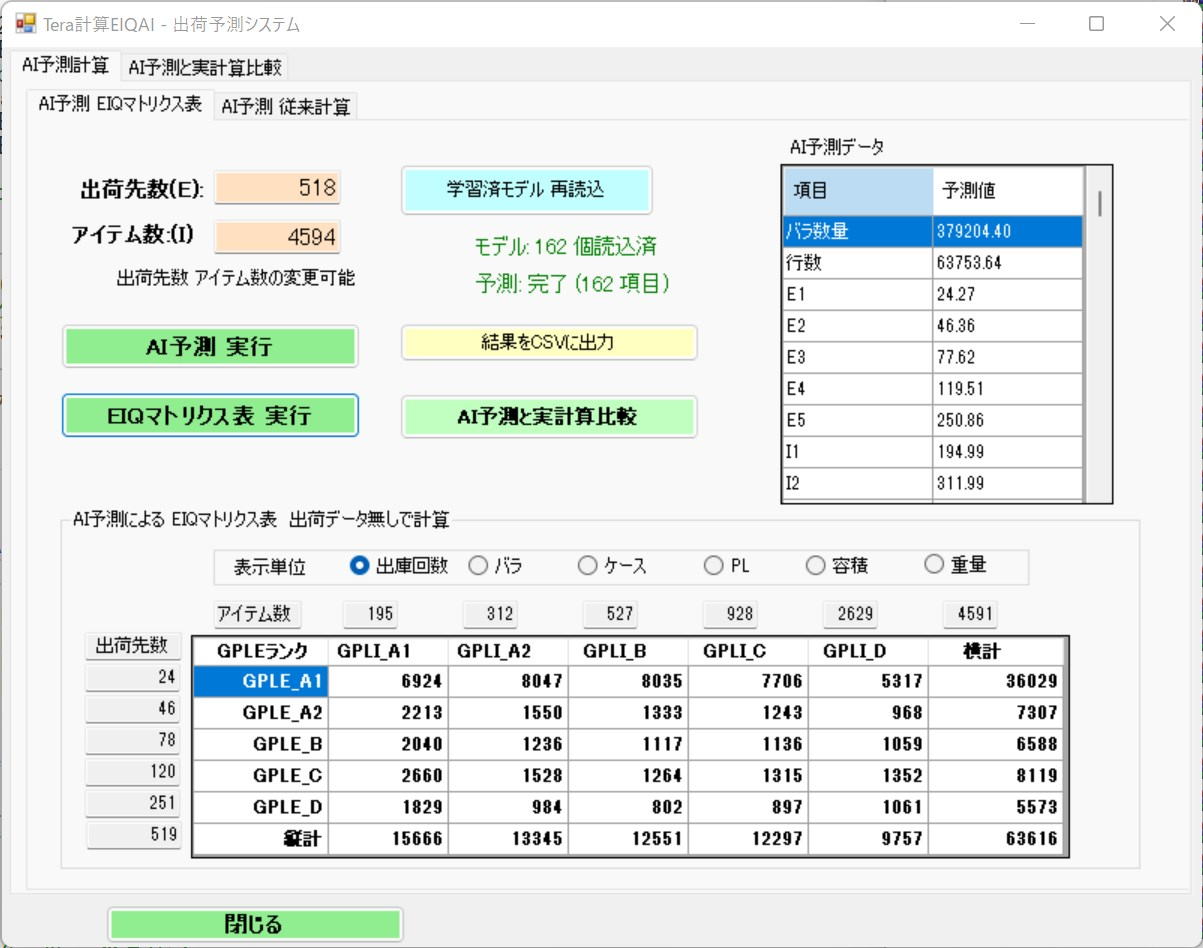
Explanation:
Following machine learning completion, entering any destination count (E) and item count (I) causes the AI to instantly calculate and display future logistics simulation outputs in an "EIQ_AI Table (Matrix)".
Users can review expected line items, volume, and weight across ABC ranks
at a glance for special situations such as site expansions, M&As, or
emergency disruptions.
This shifts facility design and staffing planning away from intuition and
guesswork toward data-driven, logical decision-making.
Screen for Verifying Prediction Accuracy of Logistics AI (Displaying Forecasts vs. Actual Calculations)
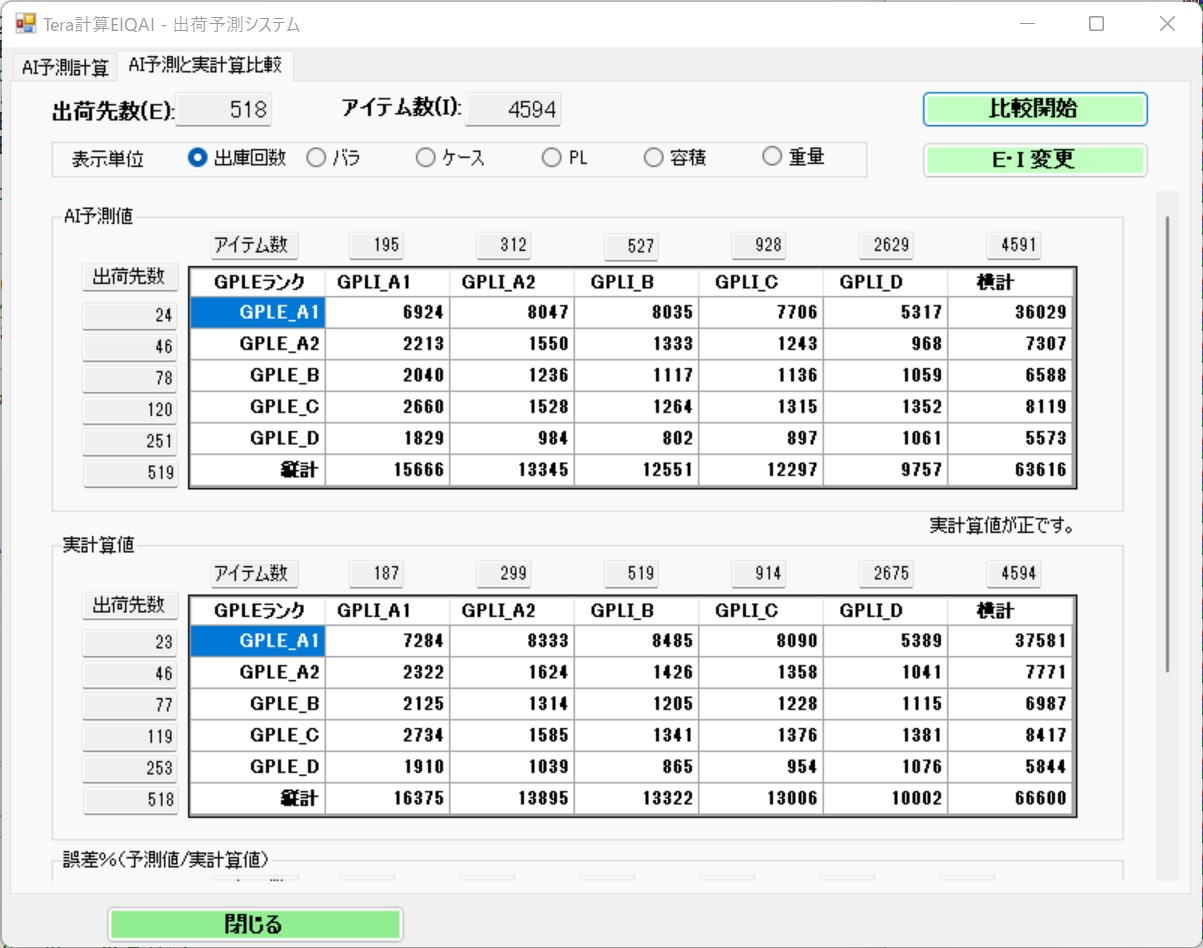
Explanation:
A validation screen used to evaluate whether built logistics AI models possess reliable accuracy for real-world deployment.
It compares "calculated ground-truth values" (derived through exhaustive manual-style processing of baseline shipping data) side-by-side with "predicted values" computed instantly by
the AI.
This allows visual and quantitative verification of how accurately model data generated via machine learning tracks fluctuations in destinations and item counts (preserving fractal
properties), boosting organizational confidence in results.
Screen for Verifying Prediction Accuracy of Logistics AI (Displaying Actual Calculations and Discrepancies)
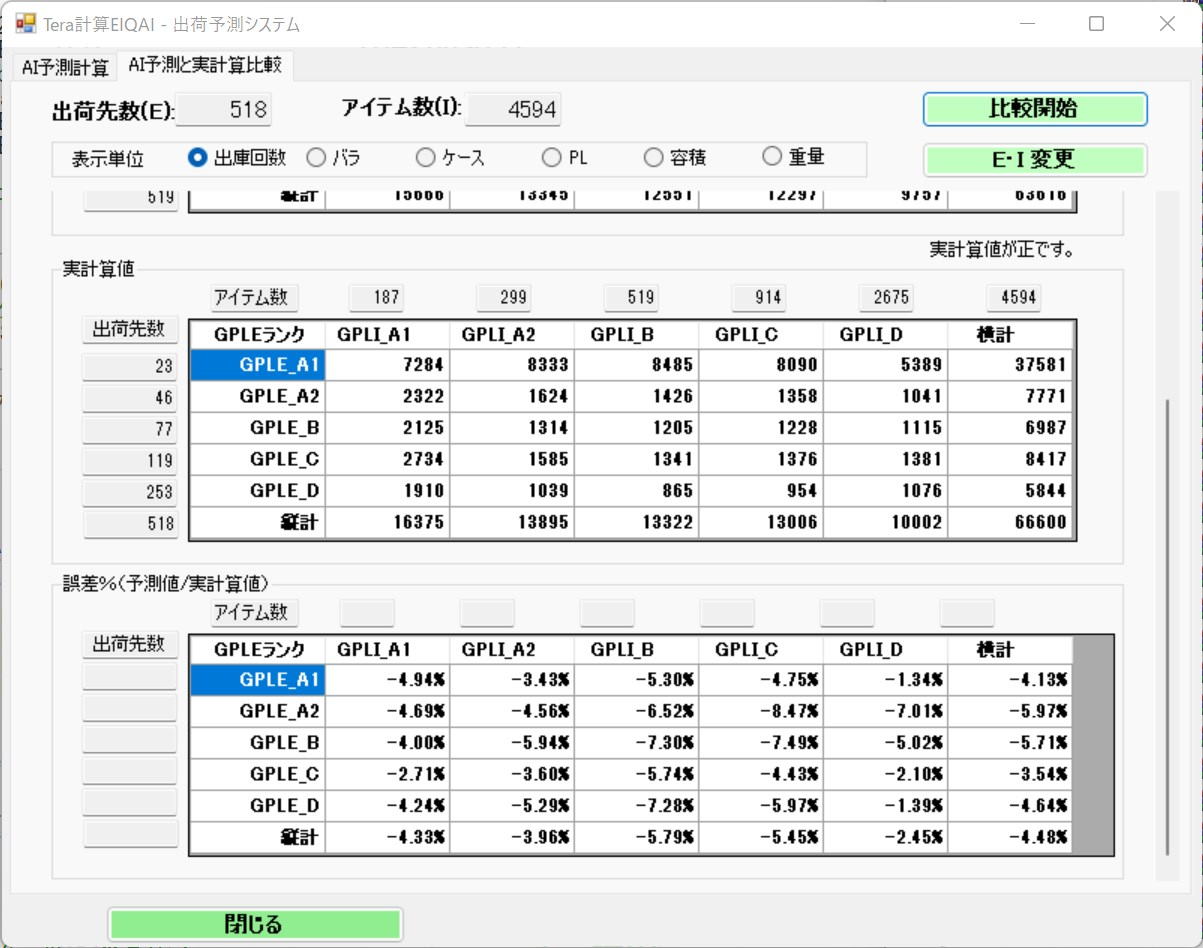
Explanation:
A screen providing deeper accuracy validation by visualizing bias trends between actual calculated values and logistics AI predictions through numerical metrics and graphs.
Because linear machine learning algorithms (SDCA regression) predict linear paths against non-linear multiplicative
curves, understanding the underestimation bias is essential.
By identifying error percentages here and applying appropriate correction factors (e.g., 1.14x multiplier), users derive practical, highly reliable logistics simulation figures ready for immediate engineering use.